View from Riverfront Park
News and views about real estate in Greater Hartford

Greater Hartford Real Estate Market Report

Thanks to a loyal reader for the request of data on additional towns. If you would like to see other towns, just comment on this blog, or send me an email offline.

All info presented is from the Multiple Listing Service as of today, for single family homes only, deemed reliable, but not guaranteed…


newingtonmay.jpg

There are 75 homes available for sale in Newington and 50 under contract waiting to close. Average days on market is 59 days. Newington is still a fast paced market and one of the more affordable towns for first time buyers.


wethersfieldmay.jpg

There are 118 homes available for sale in Wethersfield and 32 under contract waiting to close. Average days on market is 57 days. Higher end sellers in Wethersfield don’t have much competition, but only 8 properties closed in the last year that were priced more than $500K. That means there is a year’s worth of inventory on the market for this price range. :(


rockyhillmay.jpg

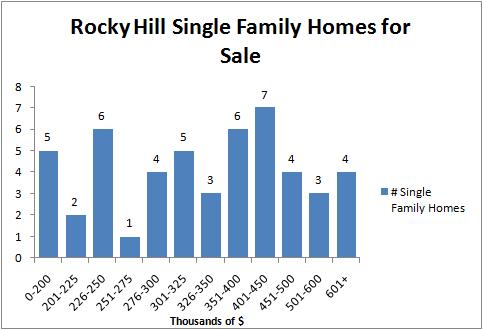
There are 50 homes available for sale in Rocky Hill and 14 under contract waiting to close. Average days on market is 52 days. Most of Rocky Hill’s higher end prices come from homes built in the late 1990’s or early 2000’s, rather than brand new construction.


southwindsormay.jpg

There are 82 homes available for sale in South Windsor and 35 under contract waiting to close. Average days on market is 73 days. Seller’s in the $300K-$400K range don’t have much competition in a price range that typically accounts for 25% of the sales in this town.


manchestermay.jpg

There are 220 homes available for sale in Manchester and 92 under contract waiting to close. Average days on market is 68 days. There are 80 homes on the market in Manchester at $200K or below. Manchester offers a lot of affordable opportunities for first time buyers, with a reasonable commute time to Downtown Hartford and surrounding towns.


glastonburymay.jpg

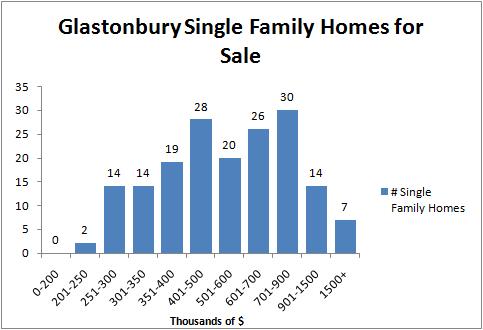
There are 174 homes available for sale in Glastonbury and 55 under contract waiting to close. Average days on market is 74 days. 28% of the homes on the market in Glastonbury were built in 2007 or are to be built in 2008.

  1. ol

    thanks for the postings.

    two things. one a question the second a suggestion.

    1) just so i understand, when you say for newington 75 listings and 50 under contract, so one can assume that the data you’re showing should be reduced by about 66%, if applied across the board?

    2) i understand that some towns are more expansive, but perhaps when you post the charts it’d be nice to see them all on the same scale, say in 50k chunks, like you did for glastonbury.

    i think what you’re showing here is great. for anyone able and cash-in-hand, this really shows the areas where one can go in and really try to make their buying $ stretch or haggle. feel bad for the sellers :)

  2. Amy

    Thanks for the comments.

    1. Newington has 75 properties that are still for sale, no offers on them. That’s the data provided in the chart. In addition, there are 50 properties that have accepted offers on them, so they aren’t really “available” any more, they are not included in the graphs.

    2. I find that for the less expensive towns, people tend to search in smaller price ranges/buckets. For example, in Manchester a person may be looking around the $200K price range, with a stretch price of $215K, maybe $225K. And when I aggregate by $50K increments the numbers become skewed by the “buckets” being too large. Higher price towns and higher price ranges have larger increments because it reflects buyer behavior. Does that make sense?

    I like providing data. I think the market should be as transparent as possible in order for people to make smart decisions that are relevant to their situation.

  3. ol

    thanks for explaining 1.

    with 2, i see your point, especially for lower priced towns. i work with data all day long, so i completely understand that there’s a million of ways to present everything and you can’t please everyone at once.

    i was being selfish here as to what i’d be interested in, which would be in the 200-250 bucket. from my perspective, i’d narrow down my town preferences and within those look for one with the biggest bucket in that range. although my plan to do this would be in second half of the fall, hopefully with even more desparate sellers on the market.

    what you provide here, i find, is exteremely valuable — i really appreciate it. i’m surprised you’re not charging for this data.

    out of curiosity, is anyone keeping track, what on average ,per each town, the % difference between price listed and price closed is? is there some magic % number that realtors advise the sellers to inflate the price by?

  4. Amy

    Yes, sale to list price ratio is commonly tracked. It typically runs 97-98% by town. It doesn’t really fluctuate that much. However, the MLS does not make it easy to track when listings expire and they are then re-listed at a lower price. This behavior makes the sale to list price ratio somewhat inflated in certain cases.

    Your “magic % number” question is an interesting one. I will respond to that one by writing a blog because I often get that question.

Leave a Reply