Yesterday I was preparing my data for the May real estate market statistics post and this morning the Courant had an article about housing prices for the state as a whole. While aggregating the state as a whole is good for a macro economic perspective, your average Joe and Jane are more likely to be concerned with what’s going on in their town or the few towns surrounding where they live, as that’s what’s affecting the micro economy that they live in.
So here’s how we did with real estate sales in the Greater Hartford area in May 2009. As always, data came from the CT Multiple Listing Service for single family homes only and is deemed reliable, but not guaranteed….
More interesting data will come with my June statistics post, as that way we’ll be able to review the entire second quarter of home purchases and sales. Simply put, more data = more relevancy.
A few observations…
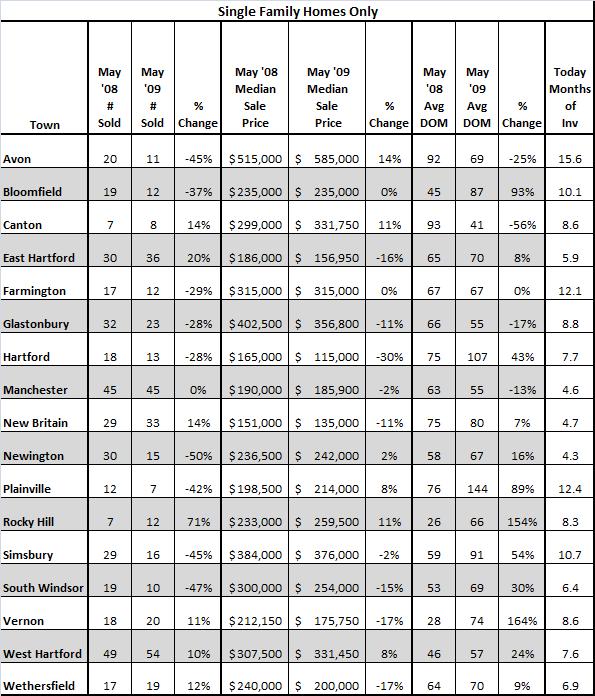
1. Eight of the seventeen towns covered actually saw an increase or no change in the number of closed sales when comparing May 2008 to May 2009. That’s the most we’ve seen in many months, so a nice positive. However, when aggregating these towns, the number of sales is down 13.1% when comparing May 2008 to May 2009, which is a slight improvement over the decline of 18.9% in April.
2. I noticed that several of the towns that had an increase in the number of Closed Sales had somewhat substantial declines in Median Price, particularly East Hartford, New Britain, Vernon, and Wethersfield. Hartford saw declines in both the number of Closed Sales and Median Price. In most cases, the decline in Median Price for these towns is likely attributable to the number of closings that were Bank Owned/Short Sales. For example, 33% of East Hartford’s Closed Sales in May were either Bank Owned or Short Sale properties. Hartford was 38%, New Britain was 39%, Vernon was 30%, and Wethersfield was 11%.
3. When I was calculating the months of inventory for each town I was surprised by the number of homes currently for sale in West Hartford. Typically West Hartford has anywhere from 215 to 240 homes actively for sale (not currently under contract) at any one time. Late yesterday there were 296 houses actively on the market in West Hartford. When I looked back at the beginning of May, there were 264 houses available. I wouldn’t necessarily expect this number to be increasing, as the spring market has started and typically it plateaus at a higher number and decreases. We’ll keep following this to see if we’re plateauing later or if it really is a problem.
Here’s how inventory has changed for each of the towns, comparing yesterday to the same time at the beginning of May. A negative number is a good sign for Sellers, the months of inventory has decreased…
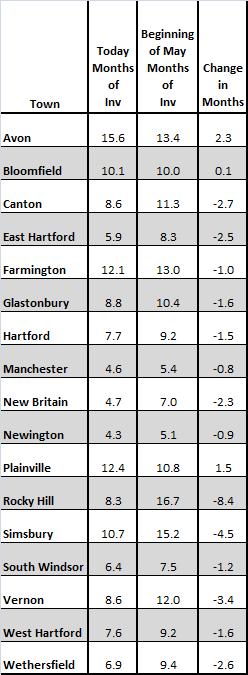
All towns shown are still a Neutral market (3-6 months of inventory) or Buyer’s Market (6+ months of inventory).