West Hartford continued to see a strong real estate market through the month of May. Below are the four main charts we track to keep in touch with the overall market in town.
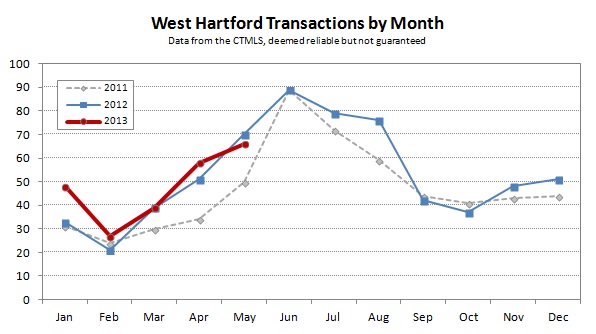
Closed transactions were down slightly in May compared to May of last year, 66 versus 70. Despite that, 2013 has outperformed 2012 in deal count over the first five months by about 11%, with 238 closings compared to 214 closings.
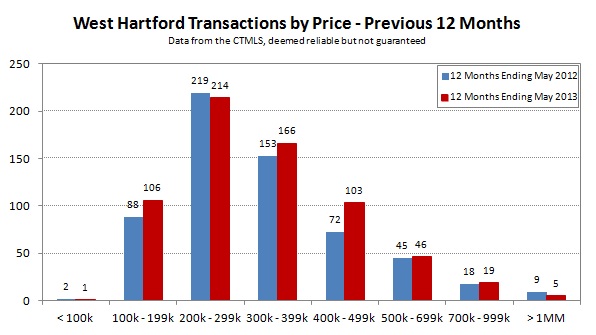
Looking at the closed sales over the previous 12 months by price band, we can see that the largest increase in activity is in the $300k to $499k price banks. These homes are an important part of West Hartford’s core housing stock and show that there is interest and activity in the market.
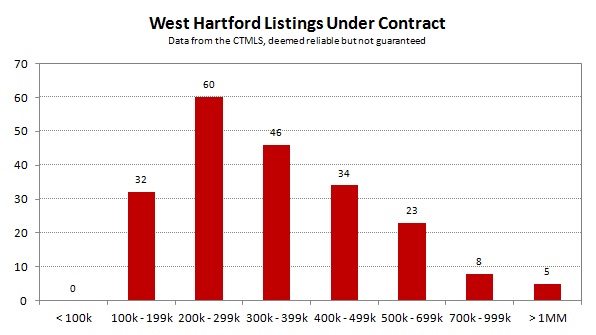
This monthly snapshot, as we approach the end of the spring market, should show a lot of homes under contract, and it does with 209. Many buyers like to close on their new homes over the slower summer months to make moving easier. The top chart also confirms this trend, with the peak of closings in both 2011 and 2012 occurring in June.
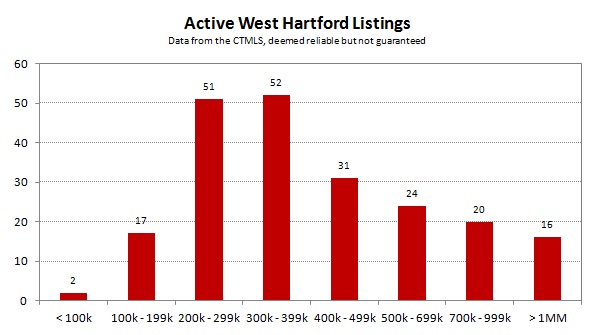
New listings continue to pop up on the market, and tend to show up all year round. West Hartford is an interesting market because it is the largest in the County (most number of deals), so it always seems like there is something going on.
But West Hartford is also one of the most diverse in the County, with homes commonly selling in the $100,000s all the way up to $1,000,000+. There are definitely times when the selection and inventory in particular sub-markets feels very limited to buyers. This is especially true when buyers are focused in on a specific price band and neighborhood within town. Competition can be intense despite there being 214 active listings as of the time we pulled this data.