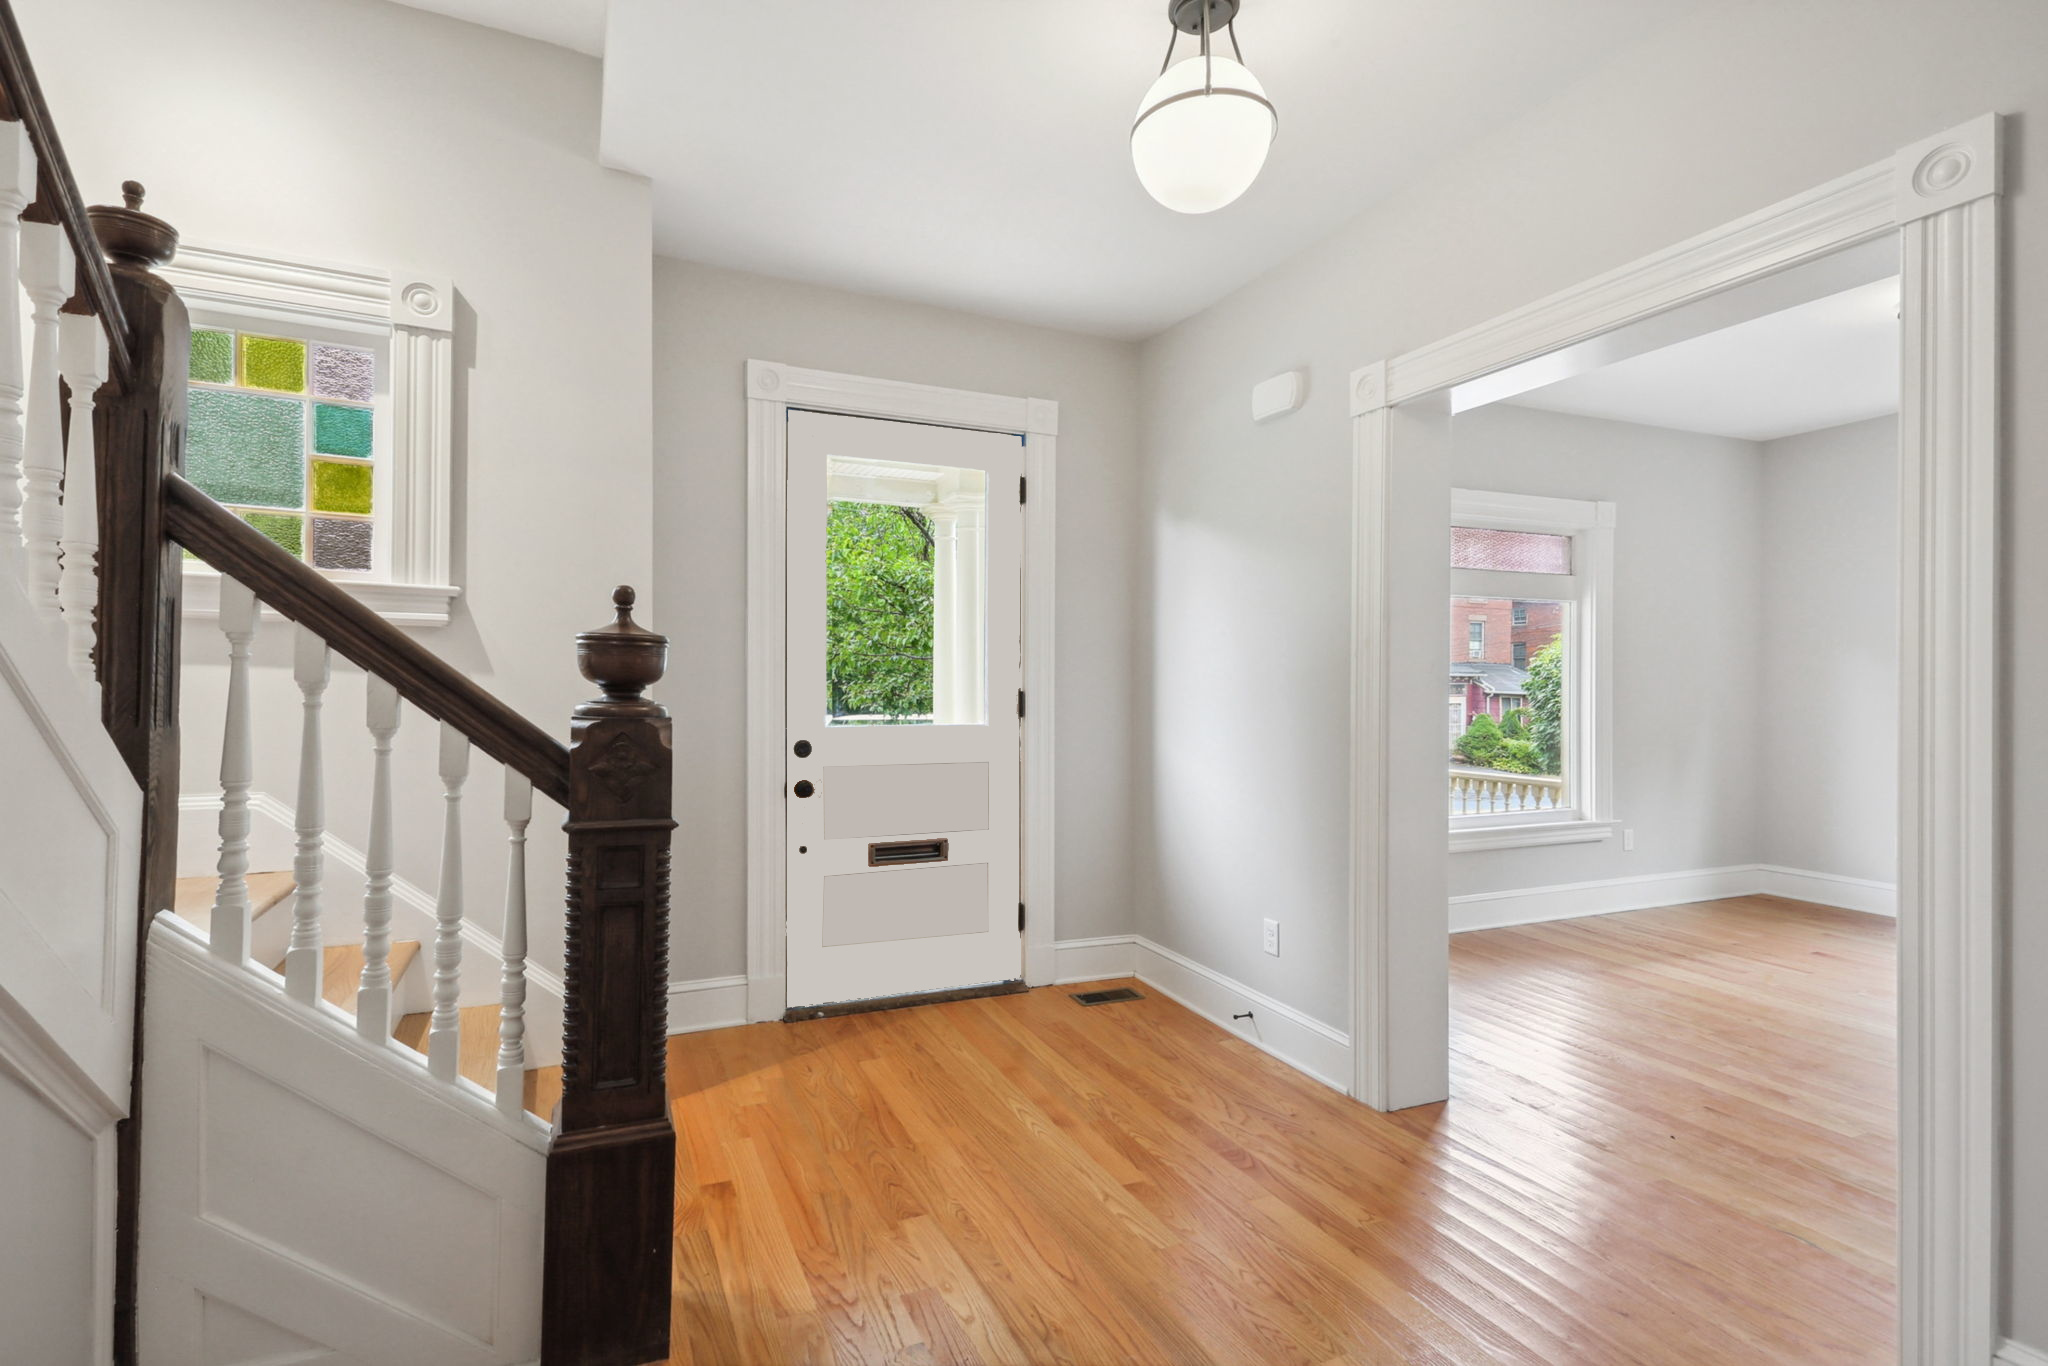
An updated Queen Anne Victorian awaits on historic Ashley Street in Asylum Hill! Neighborhood preservationists NINA rescued the building after a fire and rebuilt the interior with today’s buyers in mind. The front porch welcomes with mahogany flooring and intricate wood details. Inside, the foyer’s grand staircase is lit with stained glass windows. New hardwood floors, Harvey windows, and fresh paint highlight the living space, while the decorative fireplace and traditional woodwork give the home
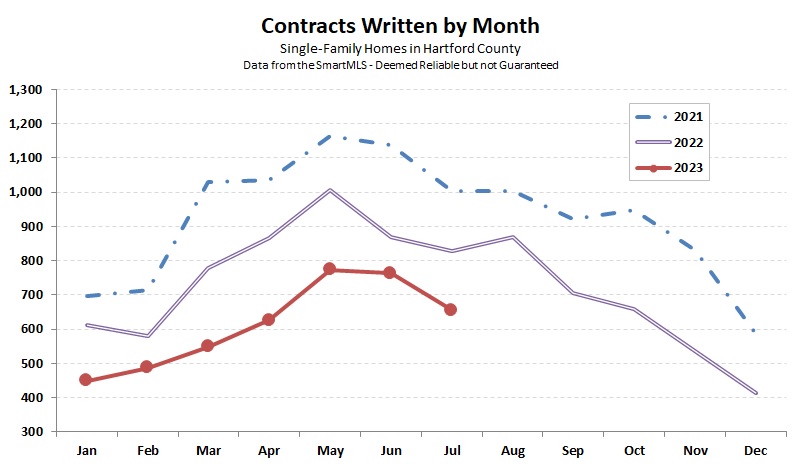
Hartford County finished July with 656 single-family contracts, 21% fewer than last July and 14% fewer than last month. On a year-to-date basis the market is about 22% behind 2022. We’re into summertime, where deals still happen but with fewer buyers participating. Listing activity was pretty good, by recent standards, with 717 new properties. By the end of the month there were 529 homes for sale, an increase over the totals in the mid-400s that
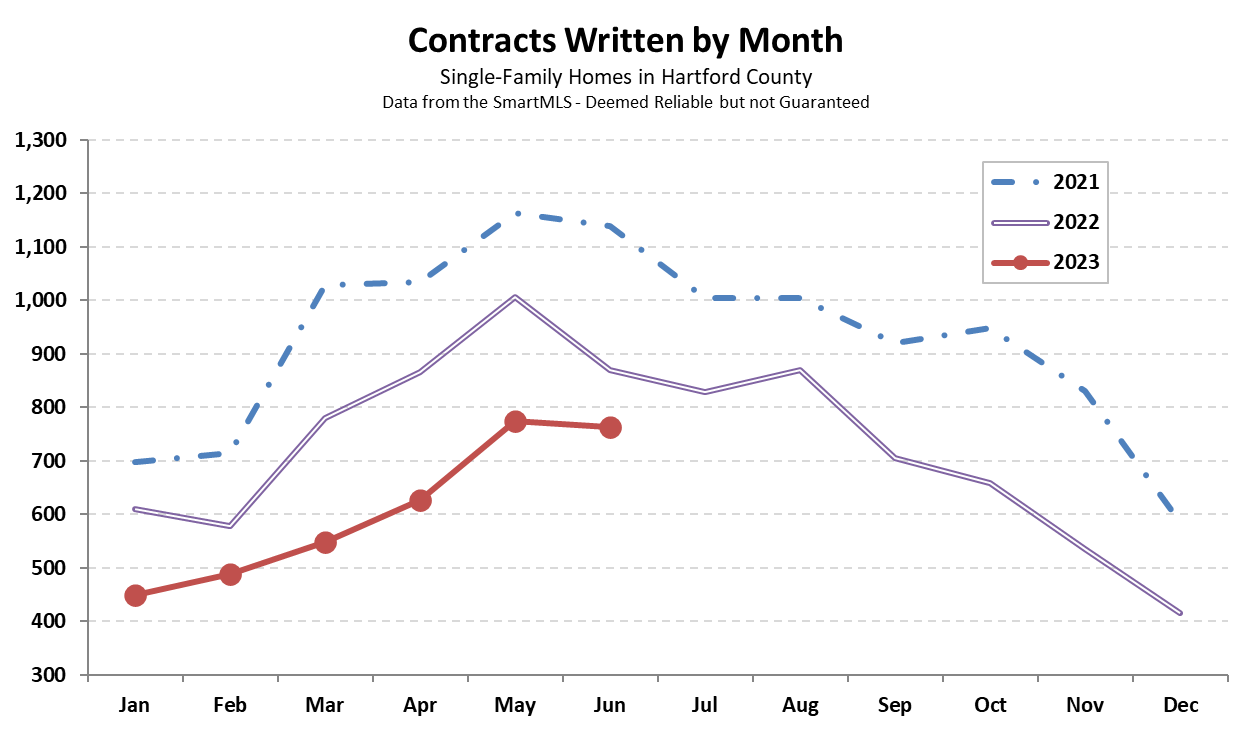
Hartford County finished June with 763 single-family contracts. The total was about 12% fewer than June 2022, leaving the year about 22% behind for the full first half. 805 new listings during June supported the number of deals, and left the inventory of active homes available level with the end of May. There are enough listings for 0.7 months worth of sales, though that is likely overstated by opportunistic sellers. 23% of active listings have
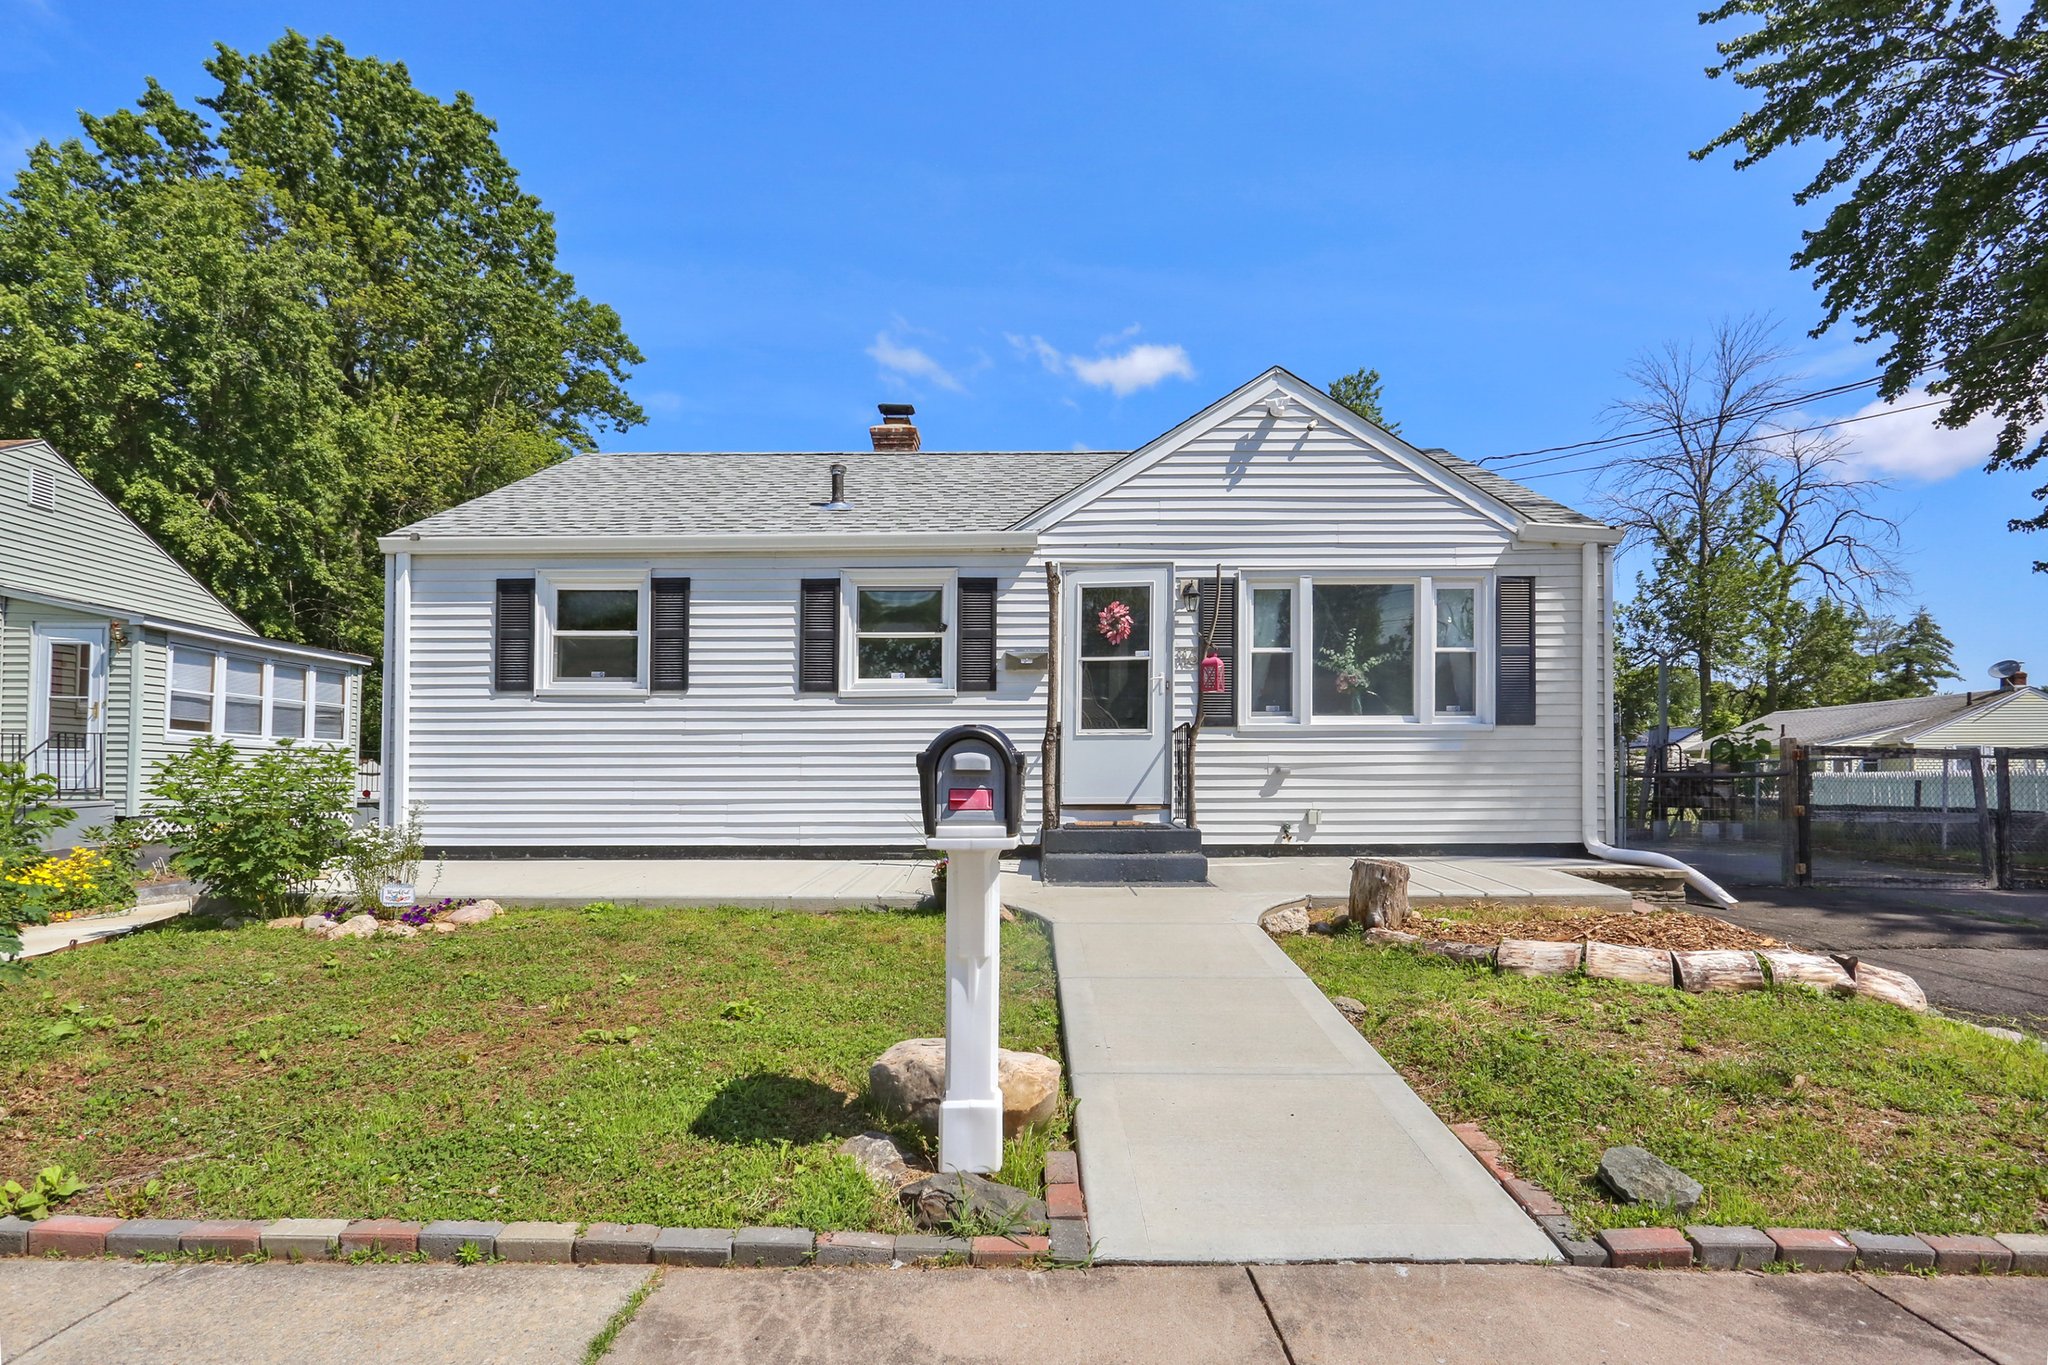
This sweet, move-in ready ranch with a magical garden space is just waiting for its new owner. Enter into the bright living room with a picture window and hardwood floors. An updated kitchen features plenty of storage space, granite counters, and an eat-in area. Three nicely sized bedrooms with ample closets and a remodeled full bathroom complete the main level. Outside, a gardener’s oasis awaits. Enjoy a meal or your morning coffee on the stamped
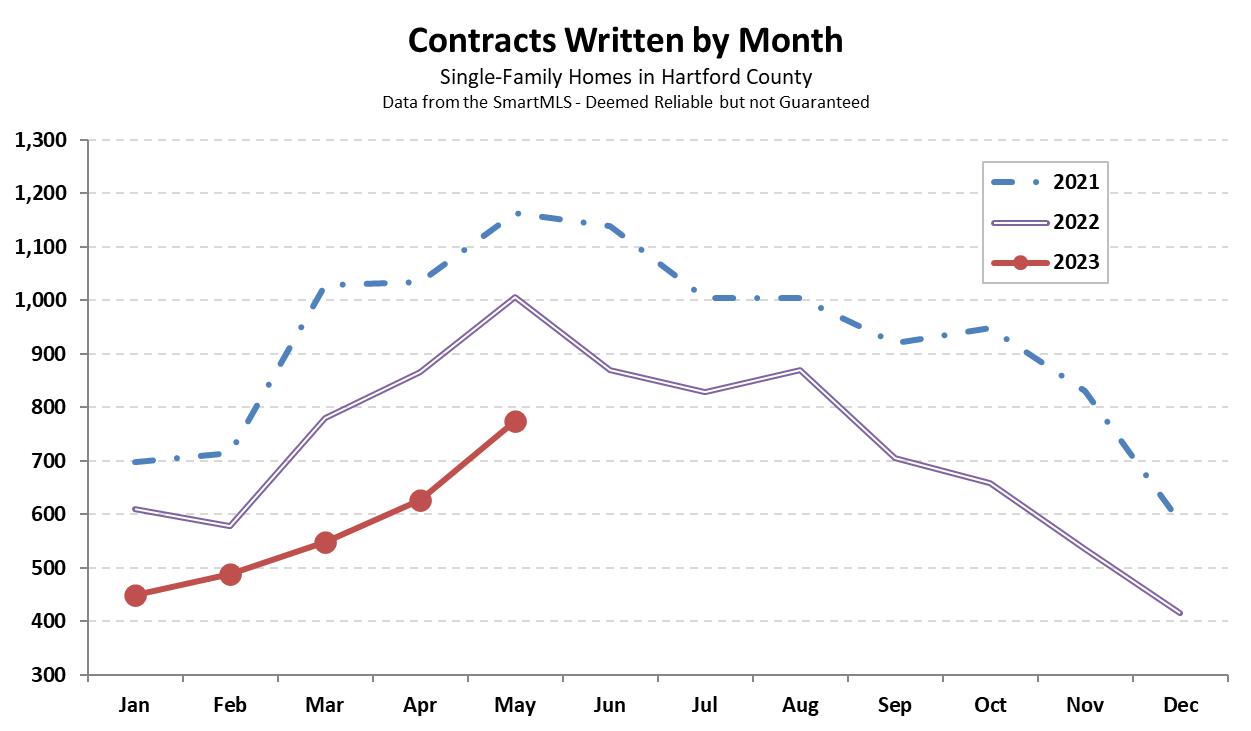
May contracts increased to 774 for the month. The result maps a typical spring trend of increasing activity each month through May. However 2023 started from a lower baseline than 2022 which started at a lower baseline than 2021. This year continued to be about 25% less active than last year. New listings jumped to 794 in May, and provided the inventory that allowed buyers to successfully write contracts on 774 properties. Active listings ticked