The Hartford County multi-family residential market continued to improve in 2019. The total number of closed deals increased about 3% over the previous year to 928 sales. Activity was up more than 56% from the low point in 2012 when the market was in disarray. Of the three residential property types (single-family, condominium, and multi-family), the multi-family market is the strongest and healthiest. This is true despite the fact that sales totals are well below
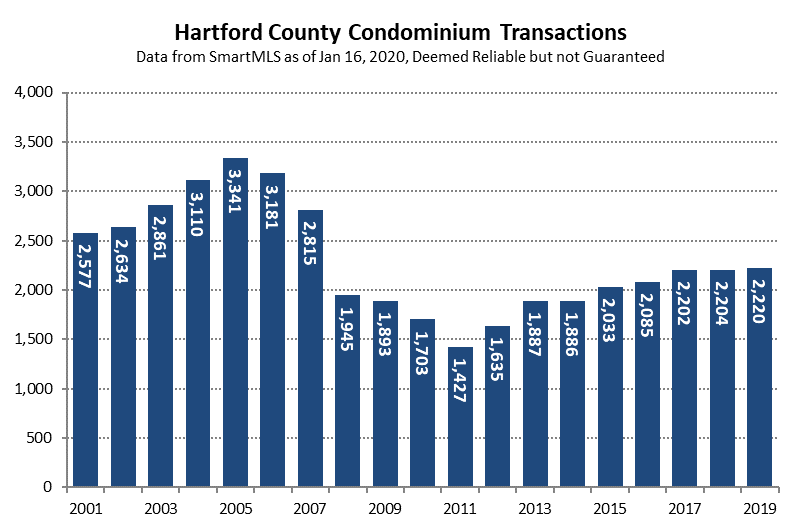
Condominiums are an important segment of the Hartford County real estate market, representing about 19% of the total residential sales (single-family, condo, and multi-family) during 2019. They offer a different mix of features and benefits than the other property types, and are usually available at a lower price point. Last year there were 2,220 condominium deals according to the SmartMLS. The total was in line with the result of the past three years. It represents
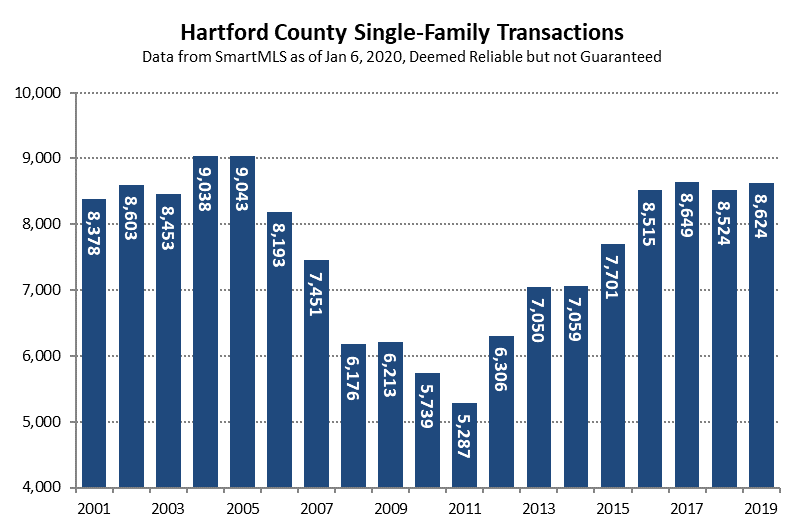
Hartford County finished 2019 with a single-family sales count in the mid-8,000s for the fourth year in a row. Data from SmartMLS shows that this was a similar activity level to the very early 2000s. A key difference from the early 2000s is that the extended period of strong sales activity has not resulted in nearly the same amount of price appreciation. The County’s median sales price increased by nearly 9% between 2015 and 2019,
I’m perplexed. It appears that money available to be earned in Hartford is less valuable than money that can be earned in West Hartford. Even though that goes against the basic idea that a dollar is a dollar. We have a 2-unit building for sale in Hartford that is quite close to the West Hartford town line. For those interested in the specifics, it’s at 307 New Park Avenue, which is across the street from
Hartford County condominiums maintained their pace of sales in 2018. The deal count increased by 2 properties from 2017 to finish with a total of 2,204 sales. The median condo sales price increased by 2% from the previous year, reaching $153,000. The positive direction was the first meaningful step upwards for the median price in a decade. One of the reasons for the long-term downward trend in the median price is that developers have sold