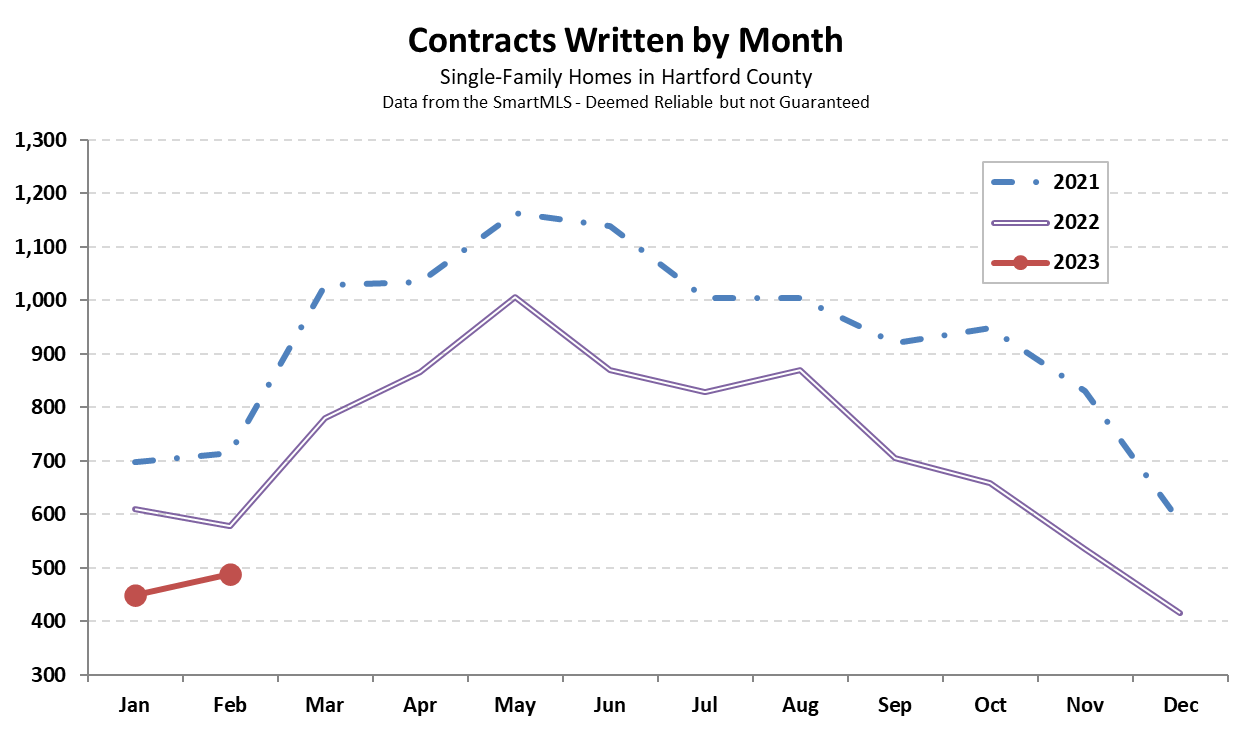
Hartford County finished February with 488 single-family contracts. The total was more than 15% below last February, and comparable to the activity level that we saw in 2010-2014. As recently noted, the bottleneck in the market is on the supply side. There are plenty of buyers, but there are not enough sellers to balance the equation. The number of contracts in a particular month has recently been closely linked to the number of new listings.
The inventory of available homes is the clear bottleneck in the Greater Hartford real estate market. Let’s take a detailed look at the number of active listings as of this morning, March 1, 2023. Hartford County has 359 single-family homes for sale as of right now. That total is the lowest that we’ve ever seen in reporting on this data since 2009. But wait, there’s more! Not more houses, unfortunately, but a more dire experience
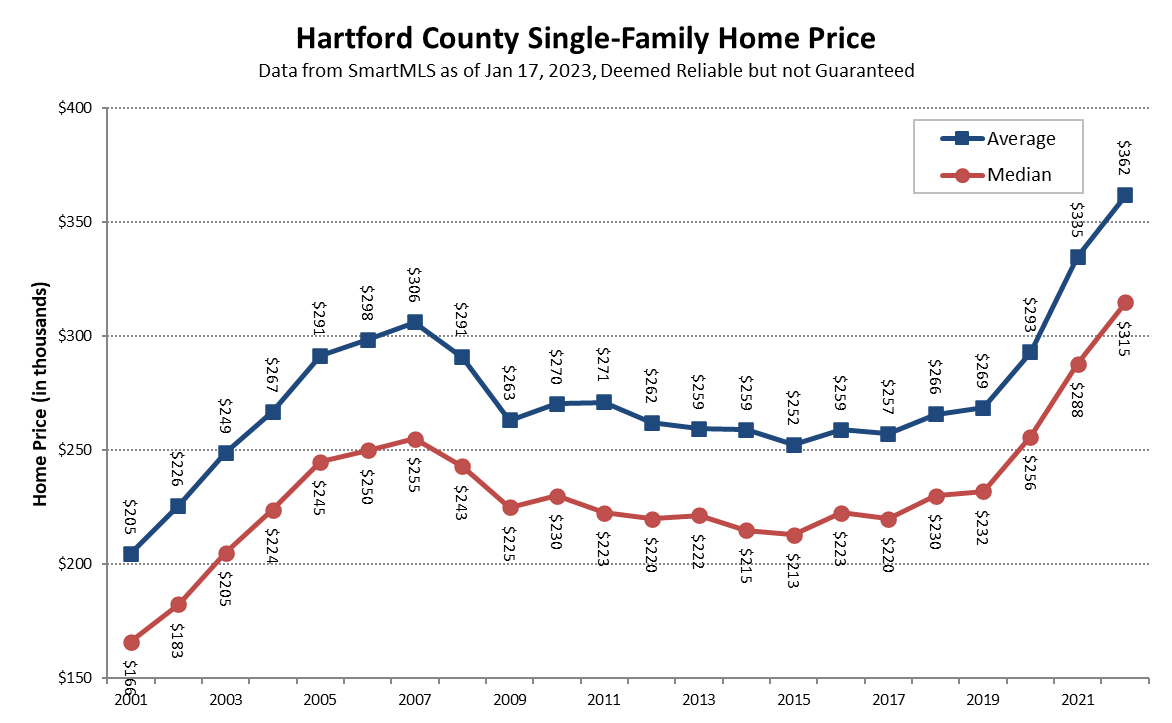
The imbalance between buyers and sellers in 2022 led to a 9% rise in median single-family home price in Hartford County. It was the third year in a row of sharp increases, bringing the rise in median value since 2019 up to 35%. Prices rose because buyers outnumbered sellers, and demand outpaced supply. There were bidding wars for nicer homes during the busier months of the year, and most sellers with a realistic asking price
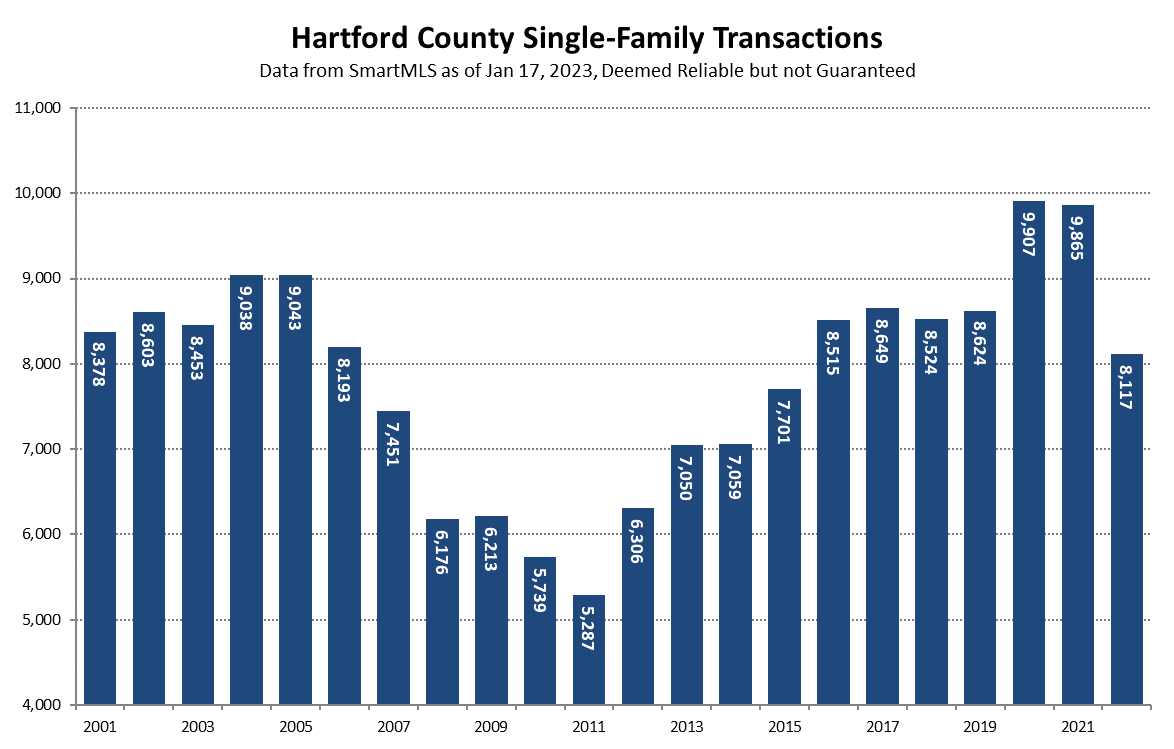
The total number of single-family home sales decreased in Hartford County by just under 18% from 2021 to 2022. Nearly 10,000 sales was reduced to just over 8,000 sales – a very significant drop. Despite the slowing pace of sales, 2022 was a strong year for the local real estate market. We consider the pandemic years of 2020 and 2021 to be outliers. There were more deals in each of those years than our area
Hartford County finished December, and 2022, with a subdued month in the real estate market. There were 415 contracts signed, about 30% fewer than in December 2021. The year finished 21% behind 2021’s totals. Inventory was the story all year long. It continued to be very low in December, and that is ultimately what limited the number of deals. Buyers who persevered through the holiday months were decisive in bidding quickly and strongly for the