Government Intervention in the Real Estate Market

Tax Credit - Trailing 12 Month Sales

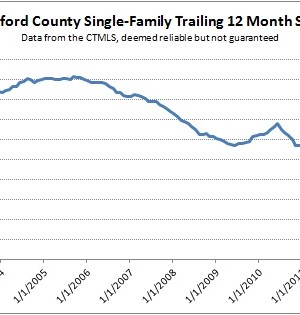
While reviewing real estate transaction data, the following chart caught our attention. It shows the number of single-family home sales that have closed in Hartford County over rolling 12 month periods. Said another way, each data point is the number of total sales over the previous 12 months. Note that this chart has nothing to do with values, only transaction counts. The line in the chart bounces around in the 8,000 deals-per-year range from the

Hartford County Takes a Breather

So it’s been a few weeks since the buyer credit expired on April 30th. How’s the market doing now? Crickets. Can you hear them? This graph shows the number of contracts written for residential properties in Hartford County. Data is grouped by week and comes from the Connecticut Multiple Listing Service, which is deemed reliable but not guaranteed. 2004 was selected as the comparison year for three reasons: 1. The days/dates match up with 2010