With national real estate reports coming out with mostly doom and gloom, I’ve had many people approach me about the local real estate market. Over the next few weeks, I’ll be posting stats from a variety of markets for both single family residential homes and condominiums. A few disclaimers…
1. All of the data will come from the CT Multiple Listing Service, so private sale data will not be included in my analysis.
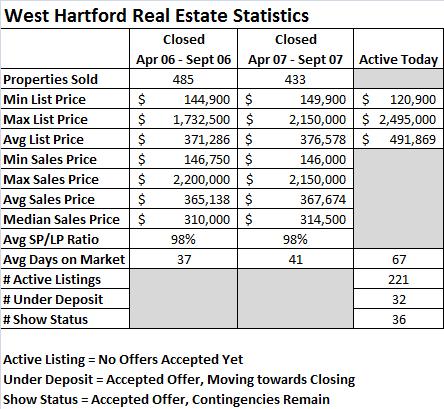
2. I’m comparing data from April through September in 2006 to data from April through September in 2007. These months are typically the most active in our local markets.
3. Per the MLS I must state “Statistical information courtesy of the Connecticut Multiple Listing Service, Inc. for the periods described. The information is deemed reliable, but not guaranteed.”
My takeaways for the overall West Hartford real estate market related to Single Family homes…
1. Prices are up 1% for the second and third quarters when comparing 2006 to 2007.
2. Average days on market are up slightly, but nothing drastic.
3. We have about 3.25 months worth of inventory on the market in West Hartford for single family homes. This is called the absorption rate and is calculated a few different ways. The simplest method is to take the number of Active homes on the market and divide it by the number of properties in Show status and Deposit status. For the West Hartford market, 3 months of inventory is healthy and in-line with the inventory levels of 2006. When inventory levels get too low, prices will usually go up because people are fighting over properties. When inventory levels get too high, prices will usually go down because there are many choices. Your everyday principles of supply and demand…
Note: The chart has been updated with the Median Sales Price and Average Days on Market info requested in the comments. I will include this going forward on all other data posts.