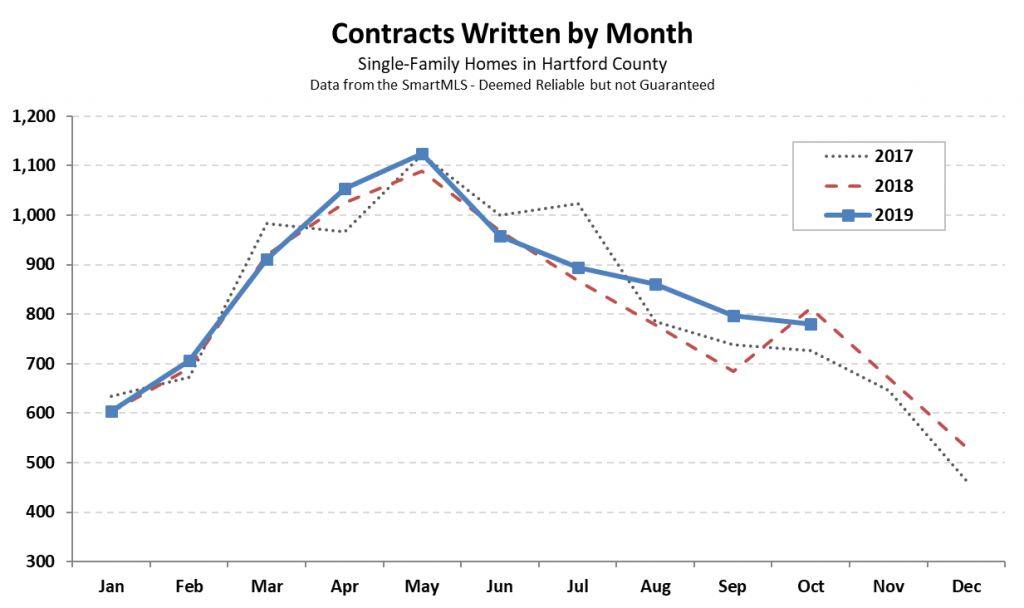
Strong Hartford County real estate performance continued through October of 2019. The month finished with 781 single-family contracts, slightly fewer than October 2018’s total, but keeping the year-to-date count about 3% ahead of 2018 overall.
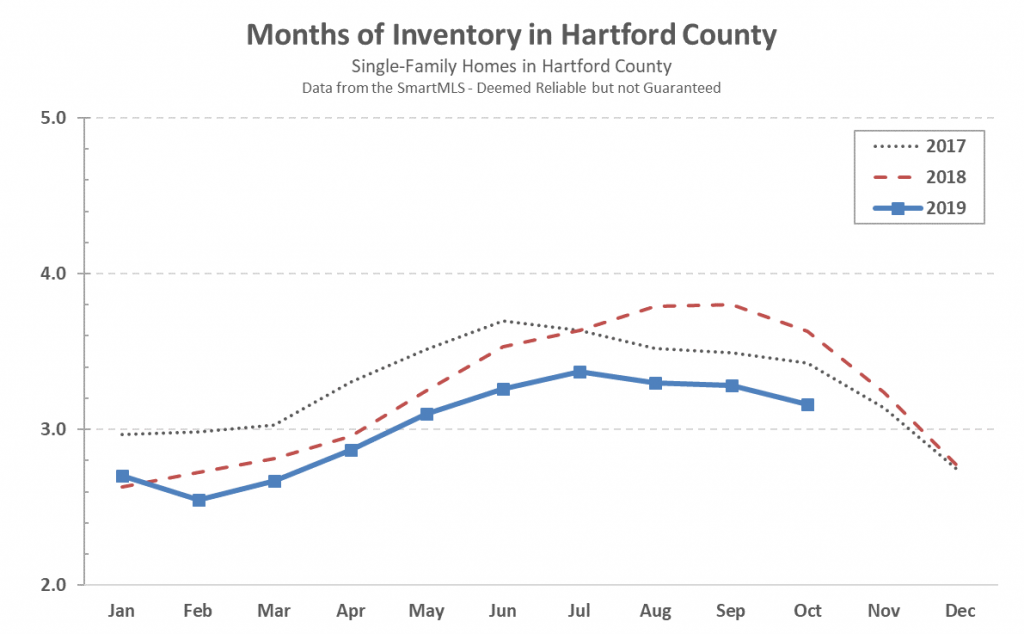
The market continued to have less overall inventory of available homes than either of the previous two years. However, the results by individual price bands (not pictured – contact us for the chart if you’re interested) show the familiar trend of very low inventory at low price points and higher inventory at higher price points. The smaller homes are where we have seen the most buyer activity.
As both of the top two charts show, November is when the market begins to slow down for the year. There are still buyers out there, and homes will still be available, but the activity level steps back a bit and inventory decreases.
Importantly, we find that the buyers still looking for a home in November and December tend to be serious. The winter market can be a good opportunity for sellers if they are comfortable with keeping it on the market.

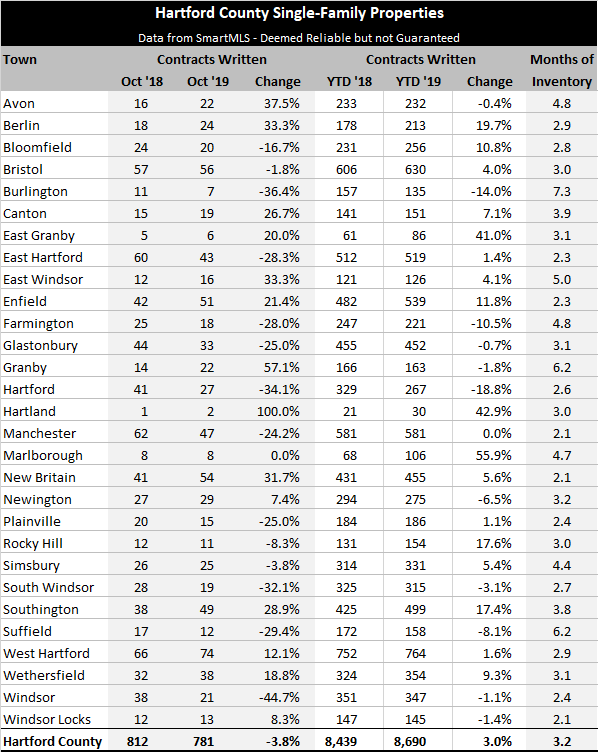
Breaking the numbers down to the 29 towns in Hartford County, the comparison of 2019 year-to-date contacts to 2018 is all over the map. Nine towns are within 2% of last year, basically flat. Only 3 towns have at least 10% fewer contracts than last year, while 8 towns have at least 10% more contracts than last year.
Once we get to the end of the year we will do a separate analysis of the closed sales to see what it says about how pricing changed in 2019. Our view is that trying to look at pricing on a monthly basis is too technically challenging (for most) to do well. Calculating the median price isn’t sufficient because every home is different and the mix of homes that sell in a single month, or even quarter, can vary widely and render the calculation meaningless.
We’re ready to help if you have real estate questions or needs – you know where to find us. Have a terrific month!
