The other day we wrote about the high levels of activity in the Hartford County market during the month of March. West Hartford really stood out on the chart because 83 homes went under contract, which dwarfed the next highest town – East Hartford with 53 contracts.
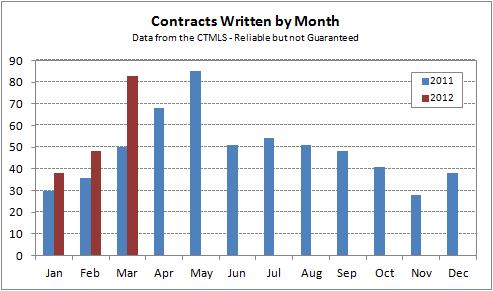
Part of the model we built to analyze MLS contract data allows us to look at trends in individual towns. Here is the number of West Hartford contracts each month this year compared to 2011.

Each of the first three months of 2012 was stronger than the corresponding month in 2011 in the West Hartford single-family market. January and February showed meaningfully higher activity levels, while March dramatically outpaced last year. What does this suggest for April and May? Just how deep is the West Hartford buyer pool?

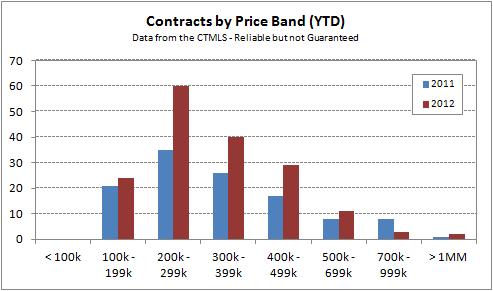
Looking at the year-to-date West Hartford single-family contracts by price band, we can see that activity has increased the most for homes priced between $200k and $499k. Homes with asking prices between $500k and $699k have been up slightly, while activity in the $700k through $999k band is actually down compared to last year.
West Hartford homes in very good condition are selling immediately, often with multiple offers, and sometimes above the asking price. We have been seeing this consistently at a broad range of asking prices. Buyers need to follow the market very closely in order to even have a chance to bid on these homes.
Sellers should go the extra mile to prepare their property for sale. Clean up, do a little staging, and hire an agent who will market it properly. For an updated home it could be the difference between just one offer and a bidding war. For a more average property it could enable you enough to reel in that first offer.

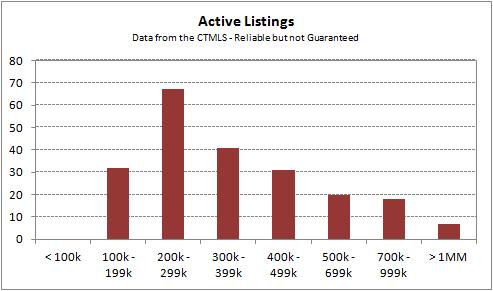
The number of active listings in each of the price bands up to $499k is approximately equal to the number of year-to-date contracts. This tells us that there is about 3 months of inventory in those price bands, which suggests that West Hartford is a seller’s market.
The $700k to $999k price band is more complicated. Inventory is much higher than the sub-$500k price bands, yet we still see strong interest in new listings. Taking a look at the actual properties available, many of the homes have been on the market for an extended period of time. Buyers have likely evaluated them and concluded that they didn’t meet their needs for one reason or another.
Real estate markets evolve gradually over time. The strong activity and interest in the sub-$500k price bands of West Hartford may be an early sign that the regional markets are improving. We are hopeful that the trends we see here will begin to spread to other price bands, and other towns, over the coming months and years.
As always, buyers and sellers need to have a solid understanding of their local conditions to make the best decisions possible. We have this data for all 29 towns in Hartford County and would be happy to share.