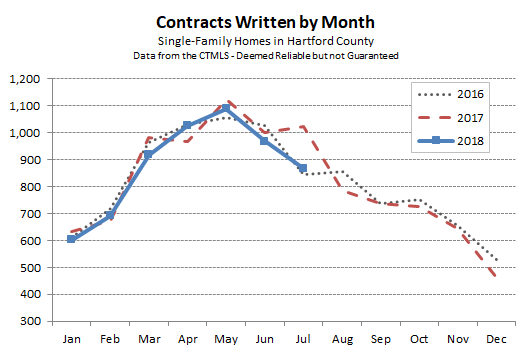
Hartford County finished July with 868 single-family home contracts, a decline of more than 15% from the July 2017 total. On a year-to-date basis the County is a little less than 4% behind where it was at this point last year.
The comparison month, July 2017, was an outlier in last year’s data. The chart above shows that the deal total unexpectedly jumped last July, unlike the total from July 2016. Because of the odd behavior in the 2017 data, we’re inclined to not worry about last month’s result appearing to be such a big miss. 2018 continues to be a solid year, if not quite as active as 2017.
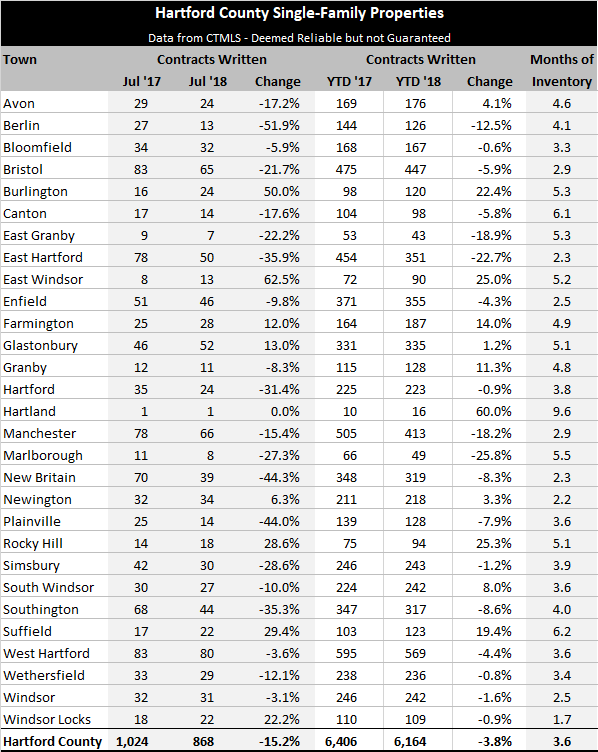
Scanning through the year-to-date performance by town in the table below, it looks like most of the towns in the Farmington Valley are having a better year than last year. On the other hand, some of the urban towns that we repeatedly highlighted last year as strong performers are showing signs that this year is a step backwards.
Inventory levels vary widely from town to town, but remain on the lower end of the spectrum. It’s possible that low inventory levels are acting as a drag on the market.
Consider East Hartford, which is more than 22% behind last year’s pace for deals. They are currently at 2.3 months of inventory, which is a seller’s market. Buyers need a reasonable selection of homes to choose from as they consider their options. And perhaps there just isn’t a good enough selection in some of the towns with low inventory. Greater Hartford is unfortunately not the type of market where people will buy any property at any price.
All of the towns that have more than 10% gains in the deal count have inventory levels of at least 4.8 months, putting them in the neutral market category. It’s a trend that we’ll monitor as we think about how to put the decrease in deals in proper context.