I’ve been tracking the number of new listings on a weekly basis to understand how the coronavirus impacted the Greater Hartford real estate market. Data about new listings is easily gathered from the MLS, and is an immediate gauge of seller sentiment. Because the market was already showing low inventory before the virus arrived, new listings seemed like it would be the obvious bottleneck in the market.
The manner in which the listing data was presented was also important. At first, I was interested in looking for changes in the pace of weekly new listings in 2020 compared to 2019. There was a very clear trend. The 2020 pace was ahead of the 2019 pace into the beginning of March, and then it abruptly changed. This signaled that the real estate market was being impacted by the coronavirus and the associated government restrictions.
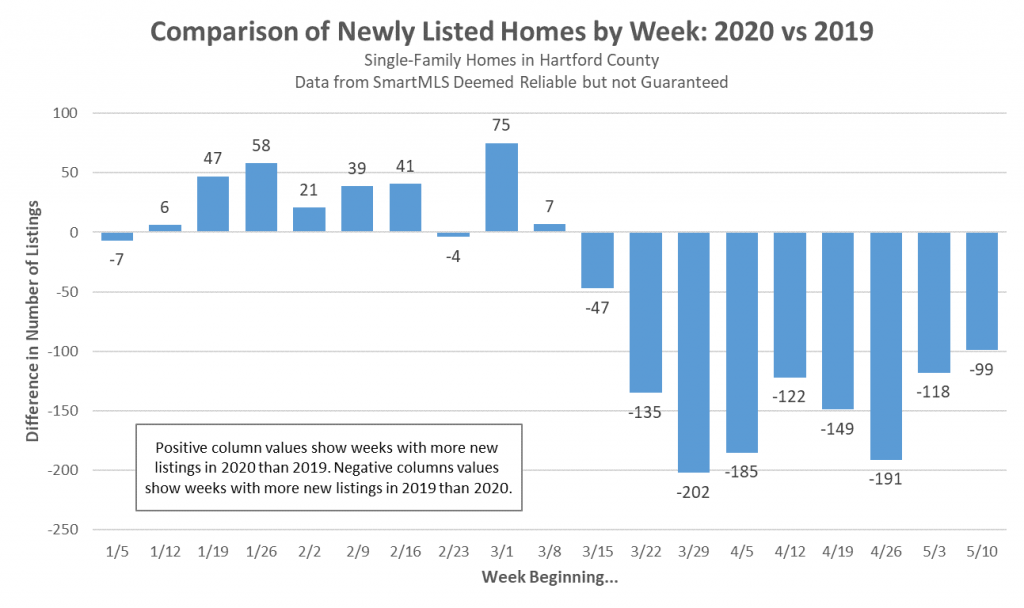
As the weeks passed, the mood in the community began to shift more towards reopening. The question I wanted the data to answer changed to this: Does the data show evidence of sellers becoming more positive?
The number of weekly listings tends to vary over the course of the first half of the year. I tried a few different approaches before settling on this chart.
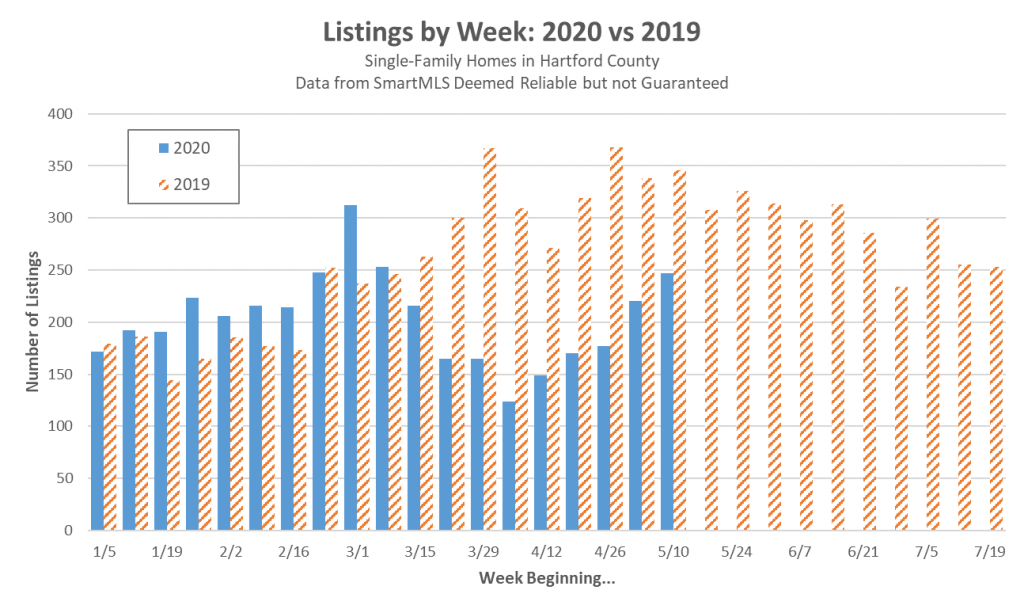
The two aspects of the market I was interested in tracking are both clearly illustrated. First, the coronavirus and associated restrictions caused the number of new listings to change dramatically in early March. Also, a sustained increase in new listing activity began in early April and continued for five successive weeks.
The mood in the Greater Hartford real estate market has clearly shifted, and sellers are working towards a more normal pace of listings for this time of the year.
Now we’re on to the next question: Will the missing spring real estate activity be lost, or will we see a delayed spring market over the summer?