I really enjoy gathering and reviewing year-end data from the Greater Hartford real estate market, probably to an unhealthy degree. There is a lot to consider this year, so I broke the analysis into multiple articles. This is Part 2 of the year-end review … the first installment focused on the number of sales.
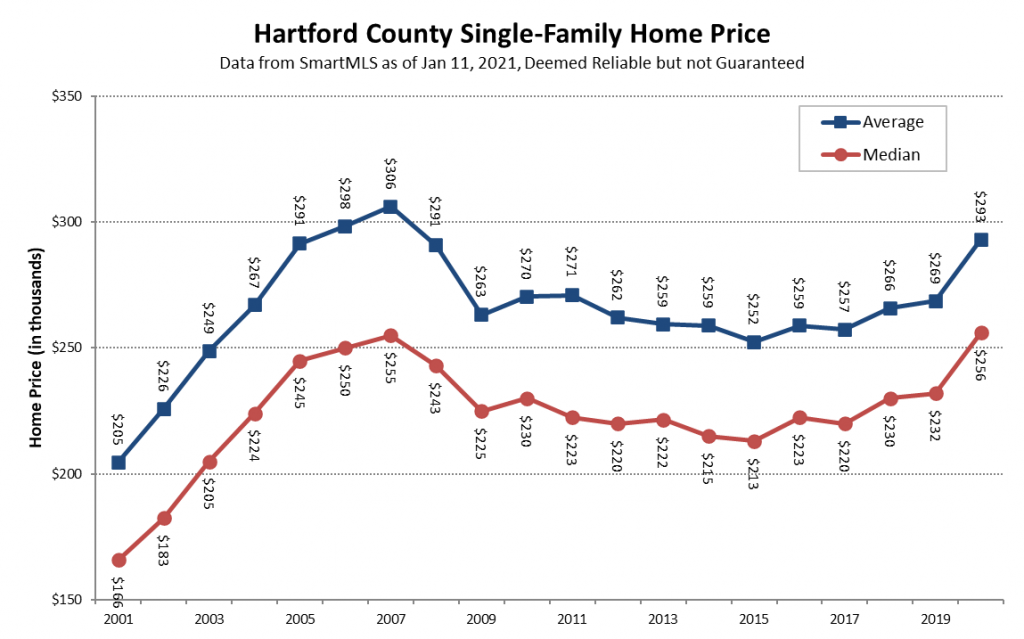
The sharp increase in demand for Hartford County single-family homes during 2020, combined with a decrease in supply of available homes, resulting in rising prices as the numerous buyers competed for limited properties. The median price in the County rose from $232,000 to $256,000, a jump of more than 10%. Prior to this year the median price had been slowly increasing since 2015, when it hit a recent low of $213,000.
Greater Hartford has historically not been a real estate market with strong price appreciation. It is clear in the chart above that after the financial crisis in the late 2000s that this area was relatively stagnant. Other parts of the country had different experiences, leaving our housing prices at relatively affordable levels.
The increase in demand for homes during 2020 is well demonstrated by the number of properties that went under contract during the year, and also by the steadily decreasing inventory. Both of those factors have been regularly discussed in past articles, most recently while reviewing the December contracts.
We’ve written less about the supply side of the equation. The chart below shows the number of new listings each week for both 2020 and 2019. There were more listings in most weeks of 2020. However, the initial impact of the pandemic during the busiest portion of the spring market created a huge deficit that the market was not able to overcome. The County very quickly fell to about 20% (about 1,150 listings) behind pace by late May. By the end of the year the deficit was down to 6.7%, which corresponded to 810 fewer listings over the whole year.
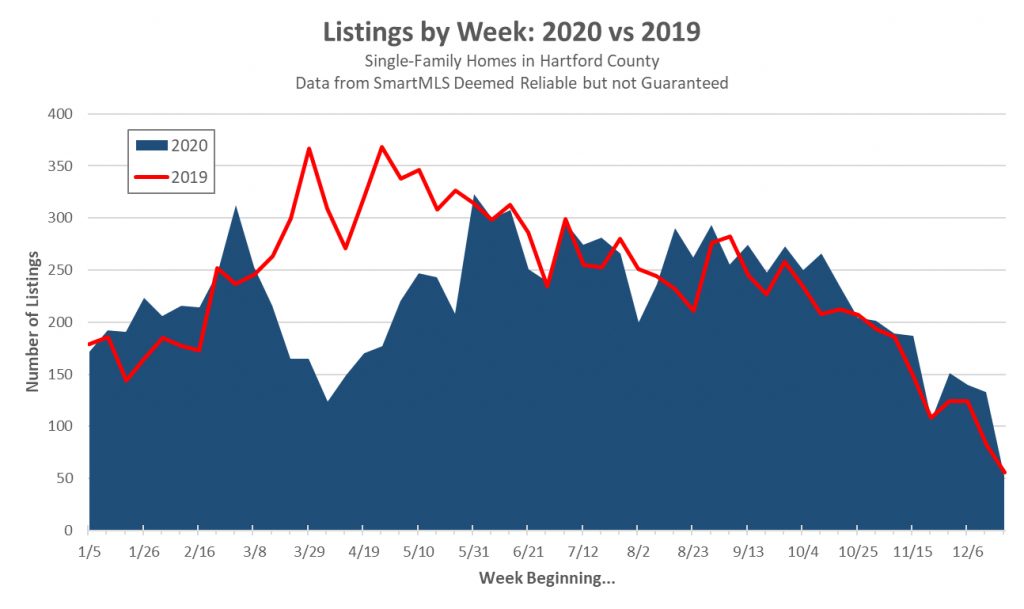
The timing of the initial wave of the pandemic was what drove the market imbalance. A sharp decrease in the number of new listings beginning in March, when buyers normally emerge, sparked the frenzied real estate environment. Also contributing was the pandemic’s tendency to discourage dense residential environments (e.g. apartment buildings and cities). Those three factors combined to created the supply and demand dynamics that led to the median price increasing so sharply in just one year.
Next: Town-by-Town Stats