We had an office meeting today and several agents in my office were commenting on how slow the market has been recently. I’ve noticed that the activity in the MLS has slowed in the towns that I typically monitor. So, this afternoon I decided to run some searches in the MLS to see how real estate markets in the Greater Hartford area are fairing.
First, how is the current inventory level of homes calculated? The most conservative way to calculate this is to take number of active properties in a town, divided by the number of closings in that town during the previous month. In this case, I looked at the active inventory in each town as of today and divided it by the number of closings in each respective town from 2/1/08 through 2/29/08.
By the most conservative estimates, it looks like just about every town in Greater Hartford is currently in a buyer’s market, with a few holdouts remaining neutral markets. The data provided is for single family homes only.
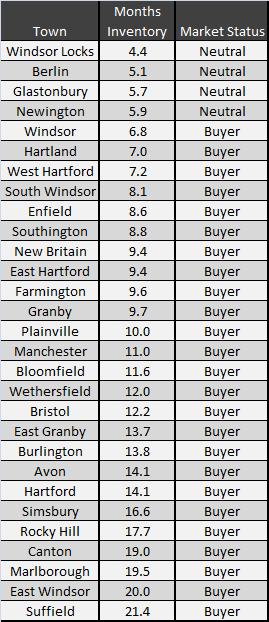
Most surprising is the number of towns that have over 12 months of inventory. February is traditionally one of the slowest closing months in our market due to residual holiday effects, weather, and school schedules, so this may be a contributing factor and slightly exaggerate the inventory levels. That being said, clearly the local markets have slowed and the data shows it.
A few comments…
1. It’s important to look at different inventory levels within different price ranges in each of the towns. Certain price ranges may have lower levels of inventory, which should result in quicker sales in those price ranges.
2. This data just demonstrates how important it is for sellers to price correctly. Make sure your agent is showing you which homes you’ll be competing against when you decide on your list price. Price aggressively and market aggressively and you will be better off than your competition.
3. Didn’t I just tell you last month that West Hartford might be a sellers market? And now it has 7.2 months of inventory? What gives? In that blog I used a more liberal estimate for calculating inventory, using the number of properties under contract rather than actual closings. Closings are taking more than 30 days at this point, which accounts for most of the difference, in addition to fewer closings in February than January. In addition, I was looking at specific price ranges.
4. Buyers are becoming more and more aggressive in their offers. I am working with several clients right now, both residential buyers and investors, that have a low ball strategy. They simply don’t care about offending the seller with an offer that may be 20% off the asking price. They are looking to find someone who is in a position where they have to respond and are willing to negotiate. As a seller, be prepared for this. You don’t necessarily have to respond, but just be ready to deal with these types of offers.
I will blog about this again in April using March data so we can compare the percentage change in the inventory levels. We’ll see if things improve as we move into the spring market. Until then, price well and be ready to respond to aggressive offers.