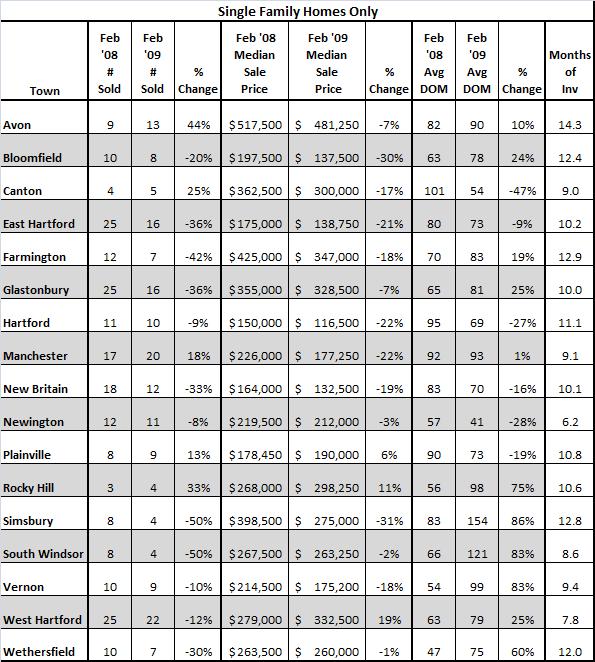
February just ended so it’s time for some more real estate statistics for the Greater Hartford area. As always, data comes from the CT Multiple Listing Service, is deemed reliable but not guaranteed, and is for single family homes only. My analysis follows after the chart…
My observations…
1. Just like January, there were so few transactions in some of the towns that this data is not very statistically relevant, particularly the Median Sale Price and Days on Market columns. I am simply including these two columns because I’ve done so in the past and people like to see the data. Those two buckets are much more relevant on a quarterly basis, so just keep that in mind. Next month I’ll do quarterly numbers after March closes, so that will give us a better look at a more meaningful dataset.
2. The number of closings are down again when comparing February 2009 to February 2008. Aggregating the data for these towns, the number of closed sales was down 17.7% in February 2009 compared to February 2008. Not as bad as the 40% decline that we saw in January, but still not a warm fuzzy number.
3. Every town in this analysis is now seen as a Buyer’s market, with more than 6 months of inventory available in each town. Remember, certain price points and neighborhoods may still have an advantage to Sellers, but when aggregating all price points and neighborhoods for a town, each is showing an advantage to Buyers right now. This is common for the early spring market, as Sellers are starting to list their homes at a brisker pace than they would during the winter months and the majority of Buyers in our market are not out in “hunt” mode until April or May. I would expect the inventory numbers to come down a bit in all of the towns in the next two months.