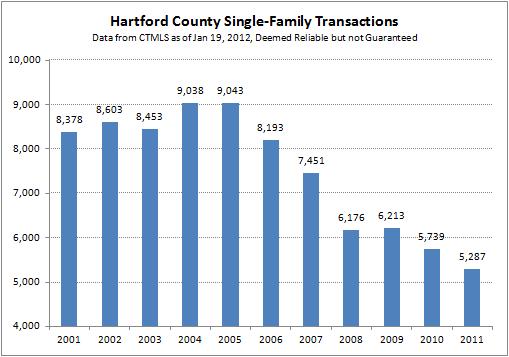
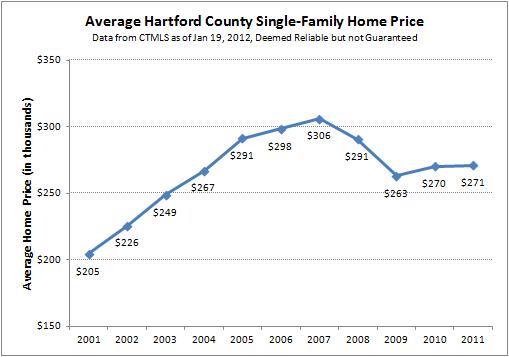
Last year we gathered up all the Hartford County residential transactions since the beginning of the CTMLS in 2000 and showed how the very high level trends had changed over 10 years. Today we update those charts with the data from 2011. As always, the CTMLS is deemed reliable but not guaranteed.


Observations
The total number of single-family home transactions fell again in 2011, decreasing about 8% from the 2010 total. With the latest data point, activity for this type of property is about 41% off the 2005 peak in Hartford County. Last year we wondered whether we had seen a bottom in the number of deals – clearly 2010 was not the bottom.
As sales volume fell, showing a decrease in overall demand, the average sales price was apparently not changed. We don’t put a lot of faith in average prices because they are strongly influenced by the mix of homes that sold in a particular year, so we think something else is going on.
Our anecdotal experience is that home prices are still falling in all the towns and markets in which we do business. We also see more interest in higher priced homes, which will tend to inflate the average, and believe that’s why the average sale price edged up slightly. We’ll work on building the case to either prove or refute this hypothesis and share that result too.
Big picture analysis like this is never especially satisfying since we usually end up with more questions than answers. What are you guys seeing out there as you follow the markets? Michael called 2011 almost perfectly in the comments from last year’s post, so we clearly have knowledgeable readers!
Also, we have this data broken down by every single town in Hartford County. If you’re interested in a specific town, email us and we’ll send you the charts.