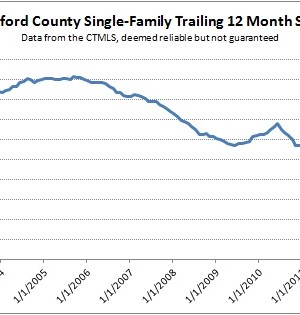
While reviewing real estate transaction data, the following chart caught our attention. It shows the number of single-family home sales that have closed in Hartford County over rolling 12 month periods. Said another way, each data point is the number of total sales over the previous 12 months. Note that this chart has nothing to do with values, only transaction counts. The line in the chart bounces around in the 8,000 deals-per-year range from the
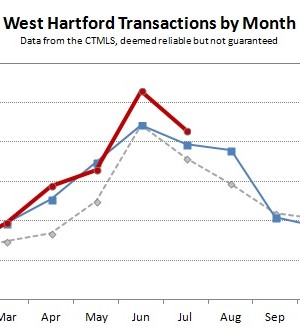
July was an active month in the West Hartford single-family real estate market, but not quite as exciting as June. There were 86 closings in July, which was modestly above the 2012 count, and on a year-to-date basis we are about 12% ahead of 2012 in the total number of closed deals. The statistics can shift a lot over the summer months. Buyers that put properties under contract in the spring close on those deals
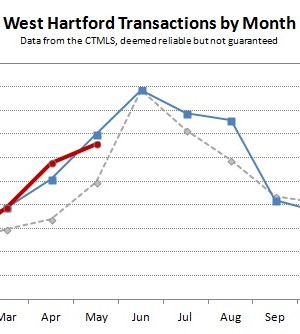
West Hartford continued to see a strong real estate market through the month of May. Below are the four main charts we track to keep in touch with the overall market in town. Closed transactions were down slightly in May compared to May of last year, 66 versus 70. Despite that, 2013 has outperformed 2012 in deal count over the first five months by about 11%, with 238 closings compared to 214 closings. Looking at
Warning: What follows is quite dorktacular. You have been warned. Last week we looked at the really big picture transactions data for Hartford County in 2011. The main concern we had with how the numbers turned out was that the average single-family home price appeared to rise slightly from 2010 to 2011, which was not what we saw in the market on a house by house basis. There is no easy way to track the
Last year we gathered up all the Hartford County residential transactions since the beginning of the CTMLS in 2000 and showed how the very high level trends had changed over 10 years. Today we update those charts with the data from 2011. As always, the CTMLS is deemed reliable but not guaranteed. Observations The total number of single-family home transactions fell again in 2011, decreasing about 8% from the 2010 total. With the latest data