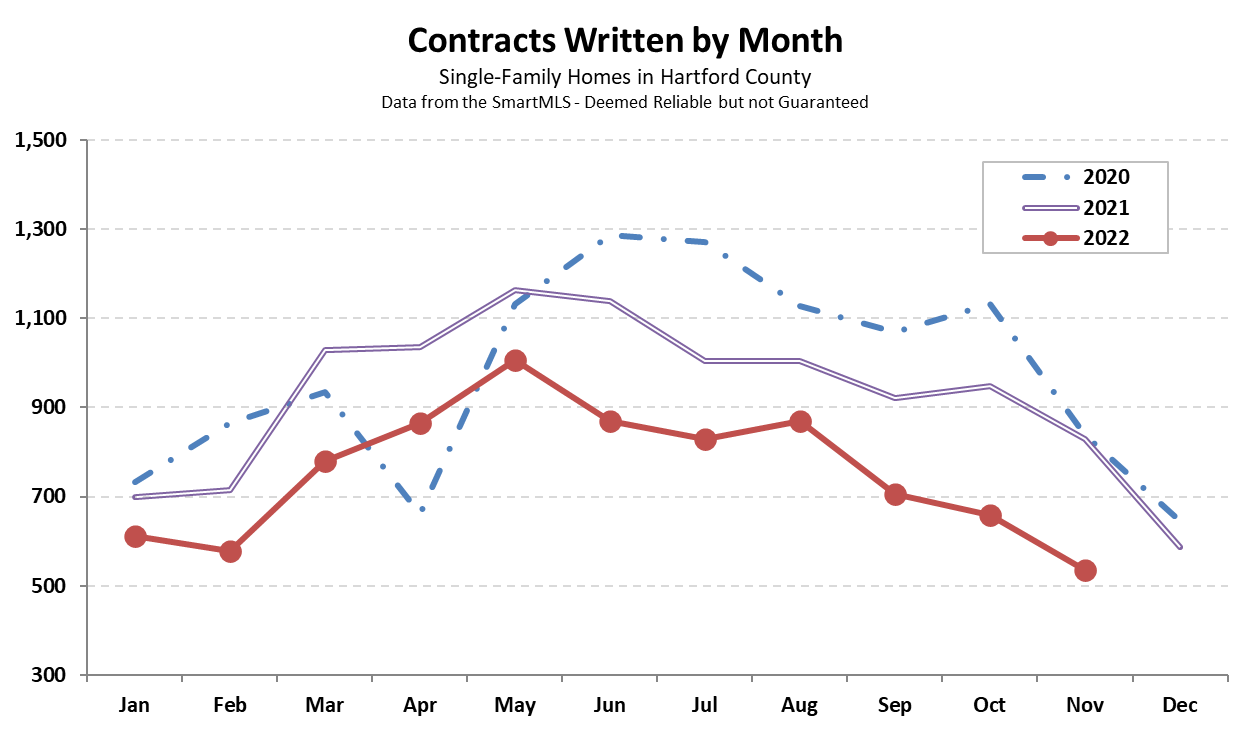
November is often a slow month for the real estate market, and this year was no exception. The County finished the month with 536 single-family contracts, more than 35% fewer than November 2022. On a year-to-date basis the County was 20% behind 2022 totals. The November total deserves a little more context. Yes, it was far below pandemic-era November deal totals. But it was also well above the totals observed during the bottom of the
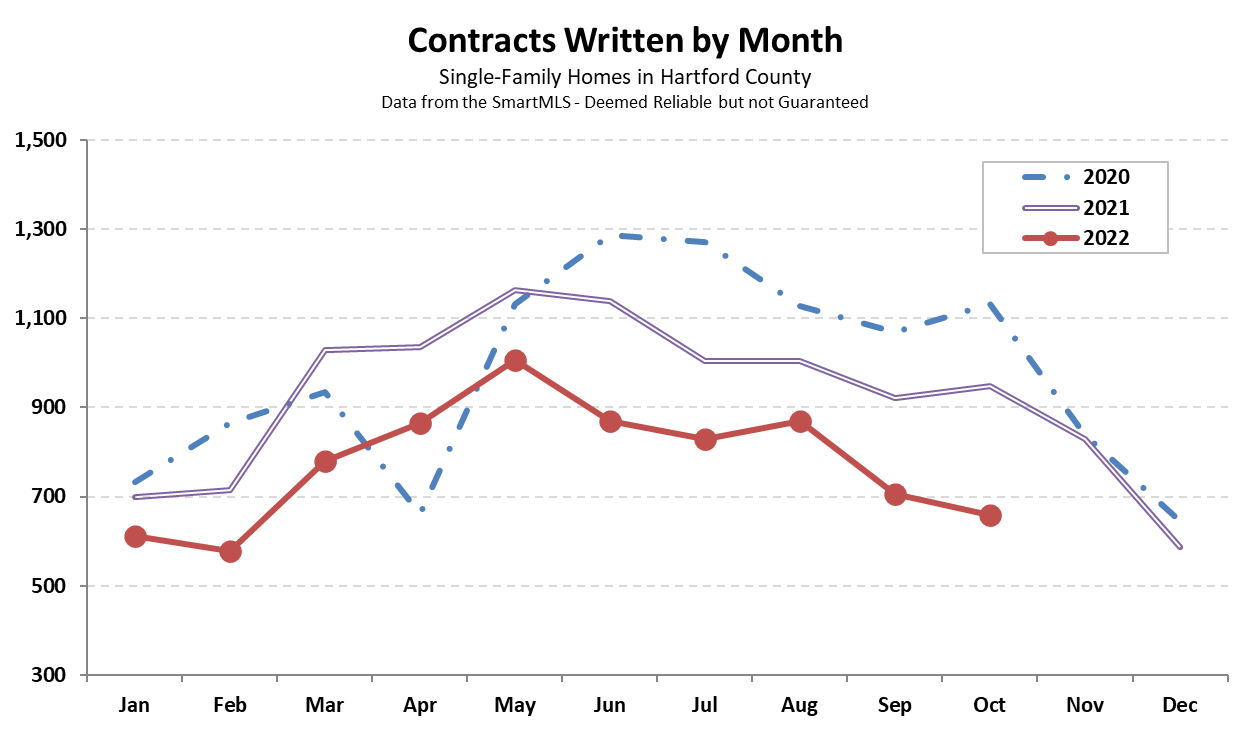
Noticeably low inventory levels and few new listings led to a quiet October in the Hartford County real estate market, effectively accelerating the winter slowdown by a couple months. The County finished with 658 single-family contracts, which was 30% fewer than the October 2021 total of 948. On a year-to-date basis the County was trailing last year by about 20%. Once again, the total number of contracts for the month closely followed the number of
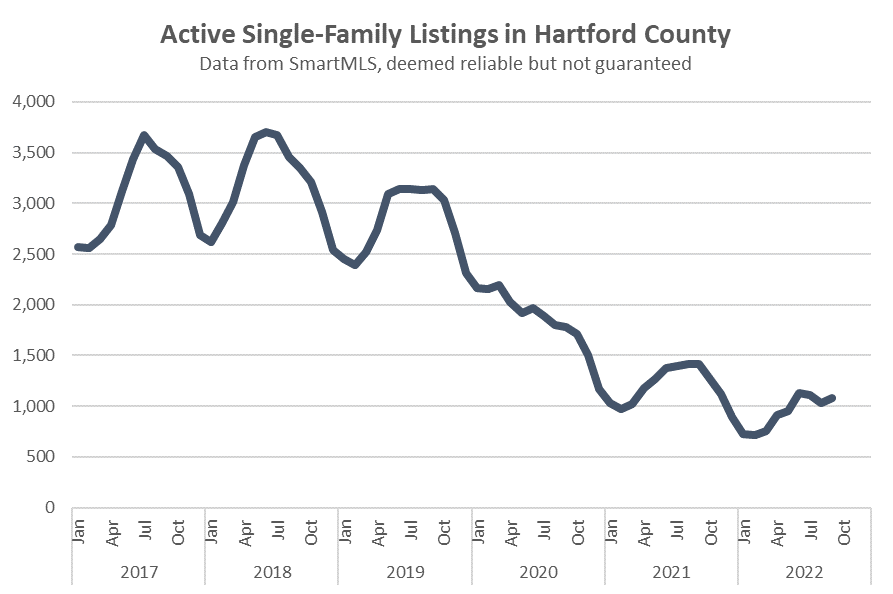
The number of active single-family home listings in Hartford County continues to be well below historical trends. The chart below shows the monthly total since 2017 as measured by SmartMLS. The seasonal fluctuations in active listings are clearly visible in each year except 2020. Inventory is highest in the summer and lowest at the very beginning of the year. What the chart shows is that the number of homes available to buyers is still trending
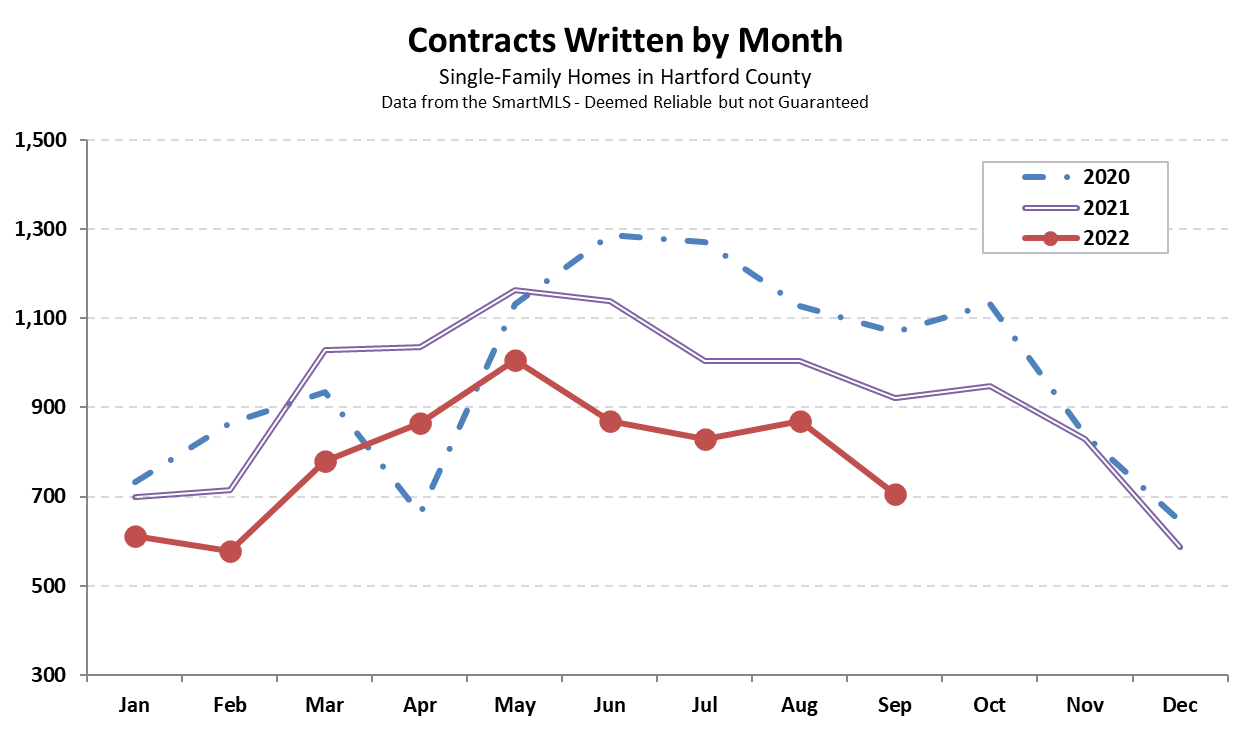
Hartford County finished September with 706 contracts, more than 23% fewer than in September of 2021. The month brought the year-to-date totals down to about 18% behind the number of deals through three quarters in 2021. The number of September listings stepped down just as quickly as the number of contracts. Inventory remained at the 0.9 months level, which means that it is possible buyers slowed down because there were fewer new properties to consider.
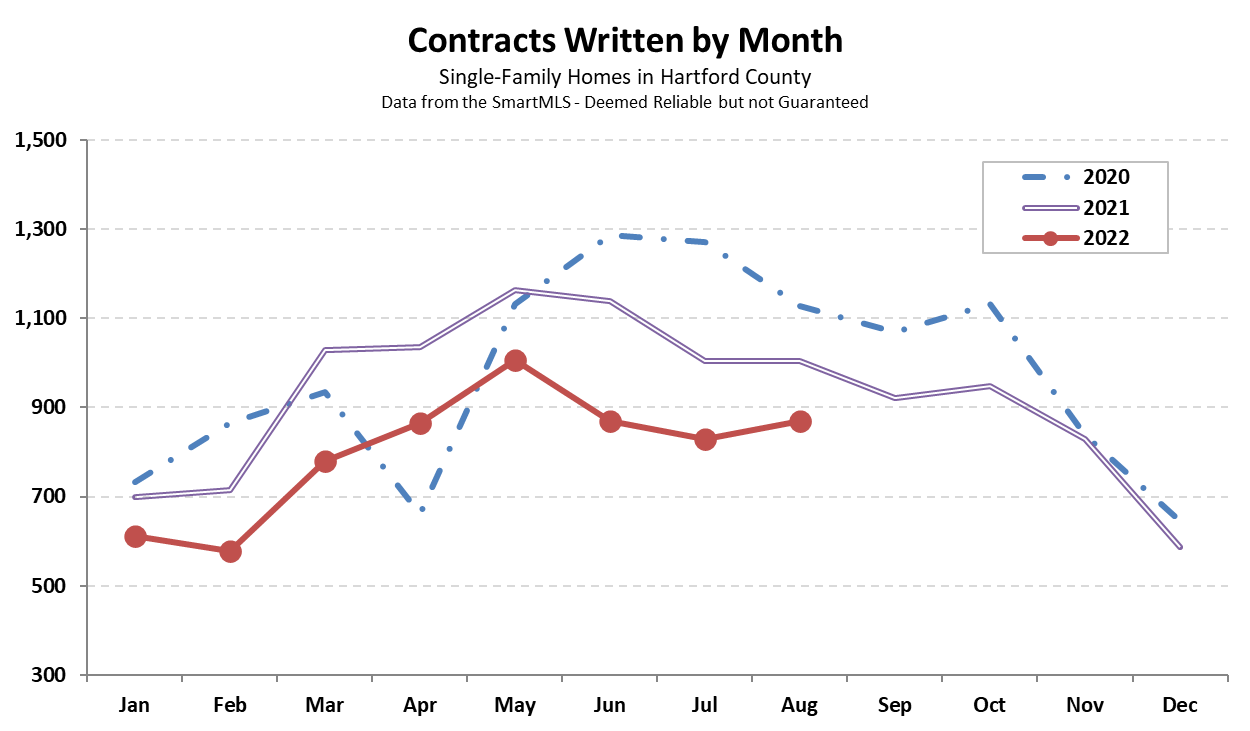
Hartford County closed the summer with an uptick in the number of contract. August finished with 870 deals, a slight increase over July but still below the August 2021 total. Overall the County was over 17% behind 2021 on a year-to-date basis. Inventory levels moved downward for the first time since January. We continued to hover around one month of homes available, a strong seller’s market, and the long-term trend of fewer options at lower