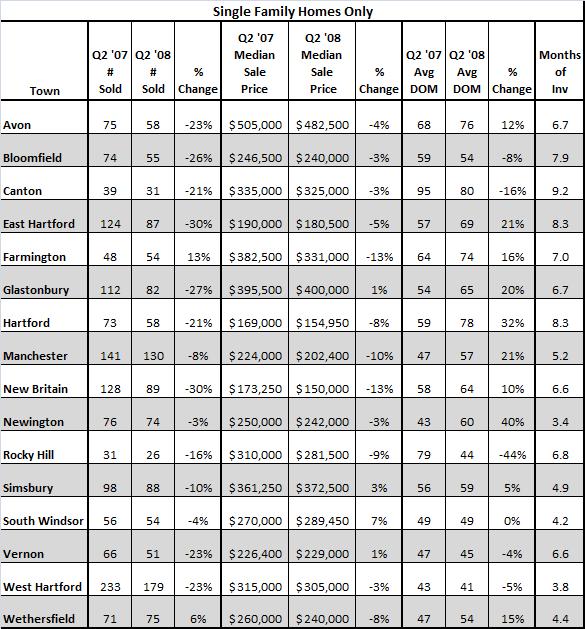
With the end of June came just about the end of the spring real estate market. So how did we do in the Greater Hartford area when comparing single family home sales in the second quarter of 2008 to the same time period in 2007? Take a look for yourself…

All data came from the Multiple Listing Service for the time period of April through June (2007 and 2008) and is deemed reliable, but not guaranteed.
With agents complaining about the market being slow, we can see why. The number of closed sales is down in almost all towns researched, with several towns seeing declines in closed sales of 20% or more. The market was lethargic in many areas this spring.
We are also finally starting to see median sales price declines as well. There is a wide range in median sales price declines. A few towns saw small increases.
Days on market (DOM) is also increasing, but modestly. Most towns did not see more than a week or two added to selling time, if there was an increase.
Most surprising to me is the Months of Inventory. Many towns have moved back into Neutral Market territory (favoring neither Sellers nor Buyers), which is historically defined as 3-6 months of inventory. With declines in the number of closed sales, this could mean one of two things; fewer people decided to sell this year or people did try to sell and took their homes off the market if they were not successful after a specific time period.
Historically, sales in July and August are slow, as people are busy with summer vacations and other activities. It will be interesting to see how the market does over the next few months.
If you are looking for data for another town which I did not include, just ask and I’ll be happy to provide it.