Last week I reported on real estate market statistics for the spring in a number towns in the Greater Hartford area. Most towns had seen a significant decline in the number of closed sales when comparing April through June of 2008 to 2007.
While those statistics are troubling for sellers, they are also troubling for those who earn their living in the real estate industry; your local real estate agent, closing attorney, mortgage broker, home inspector, appraiser, and insurance broker.
I was curious to understand how bad things really are on a transaction-per-agent basis, and I have access to the data, so I did a little digging. The results are startling.

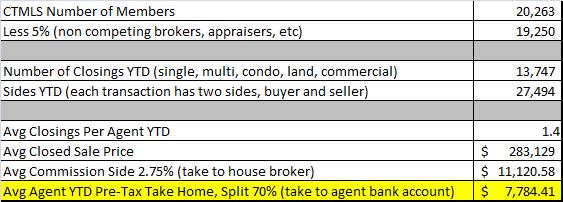
Let me explain this little chart to you.
The CTMLS is a big database that agents pay to join and it tracks most of the closed real estate transactions in most of the state. Commercial agents tend to use other methods of tracking their deals and Fairfield County has their own MLS to track their transactions, so they won’t be included in this analysis.
Anyway, there are 20,000+ agents that pay to have access to the CTMLS. Some of those people are brokers that manage offices and appraisers, so I estimated those groups to be 5% of the members and took them out of the analysis, as they aren’t actively trying to sell real estate. That leaves us with approximately 19,250 agents actively trying to sell real estate in a significant portion of Connecticut.
Then I looked at the number of closings this year for single family homes, condos, multi families, land, and commercial. Each deal has a buyer and seller represented, so the number of “sides” that agents share is actually double the number of closings. Remember, this doesn’t include Fairfield County and most commercial deals.
And now the results, getting to how much the average agent has earned this year PRE-TAX.
For each sale, the total commission is split between the buyer and seller brokers. The agent then takes their check back to the broker and it’s split again, this time between the broker and the agent. I estimated the split between the brokers to be 2.75%, as we typically see 2.5% or 3% offered in the MLS. I also estimated the split between the agent and their broker to be 70%. This split between the agent and the broker is a little bit more of a guess, as each broker has different split plans which are closely guarded. So the 70% is a rough estimate and may actually be a tad high.
On average, for my analysis with my assumptions, a real estate agent in the CTMLS has taken home a little less than $7,800 for the entire year. And that is PRE-TAX. Oh, and that doesn’t take into account the expenses for getting to a closing (advertising, membership dues, gas, etc.).
There are many agents that have done well more than the 1.4 closings this year that averaged in my chart. Which means there are many agents that have done no closings this year. 🙁
Last year, the National Association of Realtors saw a decline in membership for the first time in 8 years. I wonder what will happen locally to many of my real estate colleagues? It truly seems to be survival of the fittest right now.