The wreckage from all of the bailout antics won’t show up in the real estate market statistics for a few months, but I have a feeling that the winter market is going to be starting a little early this year.
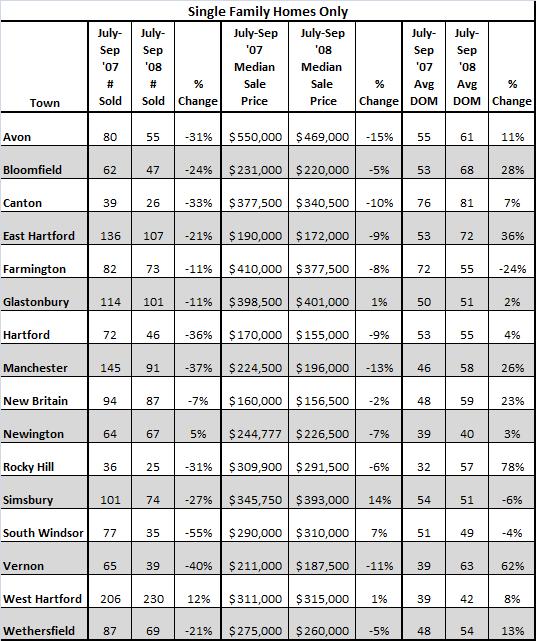
How did the housing market in Greater Hartford fair in Quarter 3 of 2008? Not fantastic. Here’s the latest Single Family data pulled from the Multiple Listing Service (deemed reliable, but not guaranteed)…

Observations…
1. The number of closed sales is down significantly for several towns. 11 of the 16 towns surveyed are off on closed units by at least 20%. Fewer buyers can get mortgages, some are taking a wait and see approach, and others have stopped looking altogether.
2. East of the River, Glastonbury remains fairly stable. Prices in South Windsor are up, but closed sales have dropped off a cliff. It will be interesting to see the final numbers for the year in South Windsor.
3. West Hartford continues to chug along as the strongest market in the area. Sales are up, selling prices are slightly up, and days on market is slightly less than 1.5 months. When will the party end?
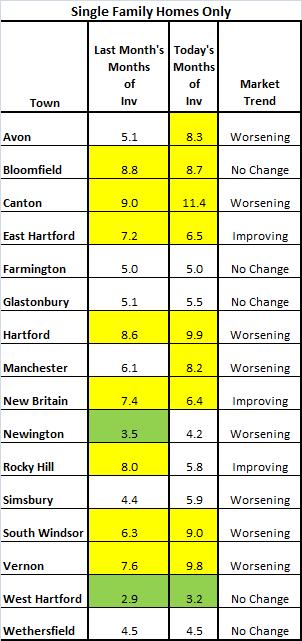
And what’s happening with the inventory situation? There are more and more For Sale signs out there and they’re sticking around longer. In most markets, inventory increased when comparing last month to today.

Yellow indicates a Buyer’s market, defined as having more than 6 months of inventory. Towns with no highlighting indicate a Neutral market, neither Sellers nor Buyers have an advantage. West Hartford is the lone Seller’s market.