Most of the year we avoid looking at prices when we analyze market statistics. Considering only a month’s (or even quarter’s) worth of data is risky because the sample size is too small, while making a more sophisticated model to account for the small sample size is beyond our abilities. However we are comfortable looking at a full year of data, and now that the calendar has turned over to 2014 we can look back on the past year to see what happened.
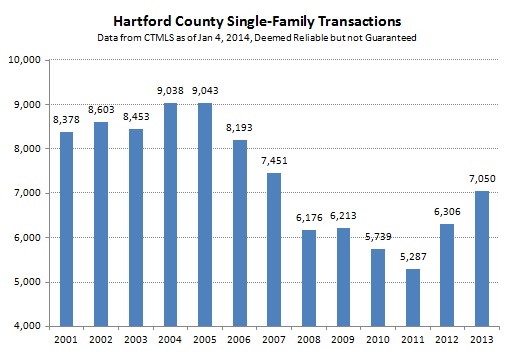
First, we noticed that real estate activity increased during the year. The number of closed transactions in 2013 was about 12% higher than in 2012. Deal count continues to be well below the consistent trend line that was established in the early 2000s, so there appears to be room for activity to increase even further.
We also noticed that median prices have not shown nearly as much strength over the past two years as the activity levels. In 2013 the median single-family sales price rose less than 1% over 2012, and remains just below the median sales price for 2011.
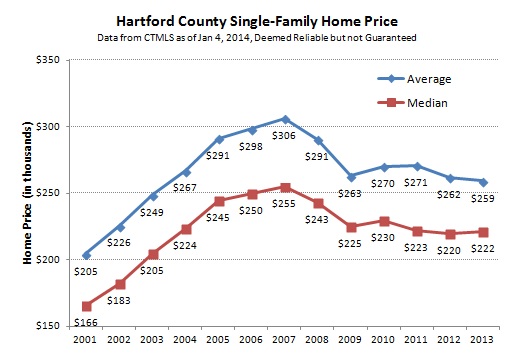
Pricing traditionally lags behind deal count in the real estate market. We saw this clearly at the top of the market, where prices continued to rise in 2006 and 2007 even though the deal count peaked in 2005 and was already falling quickly. The bottom of the market appears to be following this same trend, with prices more or less stable since 2009.
The Hartford County single-family home market has many individual town markets, and even neighborhood markets, that are all recovering at their own pace. We see some towns that are well into a recovery, with price appreciation. Other towns are struggling to find a bottom and buyers have an opportunity to really negotiate on price for their choice of homes. 2014 will continue this dispersion trend – the differences in the individual markets are likely to increase this year.
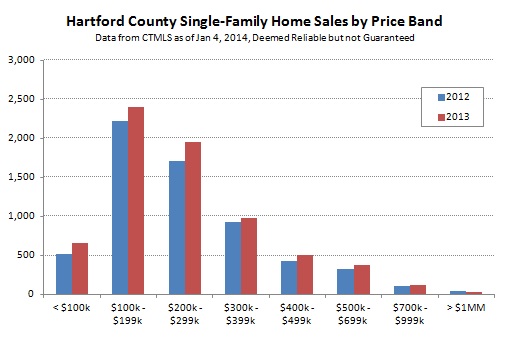
The most difficult part of interpreting median price changes is understanding how the mix of homes sold at the various price points impacts the final result. Hartford County has an active single-family market at a very wide range of prices, from less than $100,000, all the way into the millions of dollars. The number of closed deals increased in all of the categories except the $1MM+ bucket.
We know that bank-owned homes continued to be listed and sold in 2013. However, it is difficult to know the exact number because not all agents mark them properly in the CTMLS. It appears that at least 787 of the closed single-family deals in 2013 were bank-owned, which represents about 11% of the overall market. There were an additional 332 deals that the listing agent described as a “potential short sale,” bringing the total distressed sale percentage up to nearly 16% of the overall market.
Our view is that high-quality homes are attractive to buyers and seeing rising prices. At the same time, an active distressed market, with associated distressed prices, is putting downwards pressure on properties that are not in top condition. Buyers looking to update a home are more likely to go after the cheaper bank-owned property than a non-distressed house of the same quality.
We expect the local real estate markets to continue to improve in 2014. We’ll postpone our detailed predictions for now, but the big-picture trends are positive in Hartford County. Please let us know if you have specific questions about your town/property – we’re happy to help. Next week we’ll provide specific, town-by-town data for Hartford County.