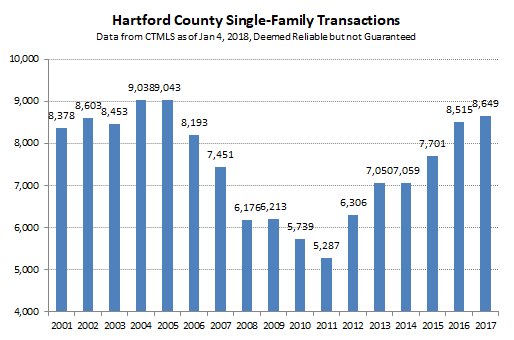
Hartford County finished 2017 with a slight increase in the number of single-family home sales compared to 2016. The total in the Connecticut MLS database as of 1/4/2018 was 8,649, or 1.6% higher than the previous year. Although there wasn’t significant growth in market activity, the deal total for the year remained close to the 2005 peak, signifying strong overall demand.
Looking at the trend in pricing, the chart below shows that both the average and median sales price fell in 2017 compared to 2016. There has been little progress in pricing for years, with both metrics just below the 2009 result, and well off the 2007 peak.
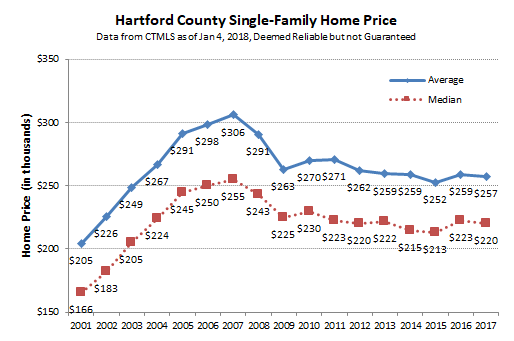
Pricing results are not uniformly bad, despite the middling numbers, but it is difficult to see the bright spots when reducing the entire market to a single data point. Additionally, the decrease in the average and median prices is a bit misleading, as will be discussed below.
Lower price bands showed a strong increase in activity over the past few years. Most of the housing stock in the region is worth between $100,000 and $300,000. In 2017 those deals represented nearly 65% of all sales. Those are the price bands that experienced consistent buyer interest and rising prices. The upper end of the market continues to struggle with low demand and downward pressure on prices.
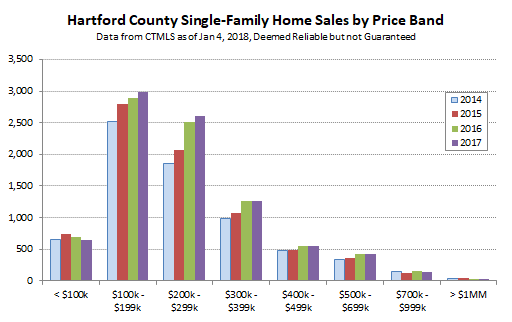
Distressed sales are a meaningful part of the Greater Hartford market. The percentage of single-family homes sales that were either foreclosures (bank owned) or short-sales (seller owed more than mortgage) remained steady at just over 13%. Most of the deals that closed for less than $100k were distressed (456 out of 652, or 70%), though more than half of the distressed deals closed for more than $100k.
Differences in buyer demand at the various price points have been evident for years. 2017 continued the trend of strength at the low end and weakness at the high end.
It appears that average and median prices decreased because of how those numbers are calculated rather than because of buyers bidding less. In 2017 the number of buyers for low end homes increased versus 2016, while the number of buyers for high end homes decreased. The mix of sold homes changed. Therefore, when the average and median prices were calculated, the mix of sales ($200,000 deals vs $500,000 deals) forced the overall average and median prices down.
Prices fell for technical reasons, not because individual homes are necessarily worth less than they were last year (though some are worth less). The big picture takeaway is that headline numbers like median sales price can’t always be trusted. It is important to get into the numbers to understand the details.
We’re looking forward to seeing what 2018 brings. As always, we are happy to answer questions for folks who would like more information.