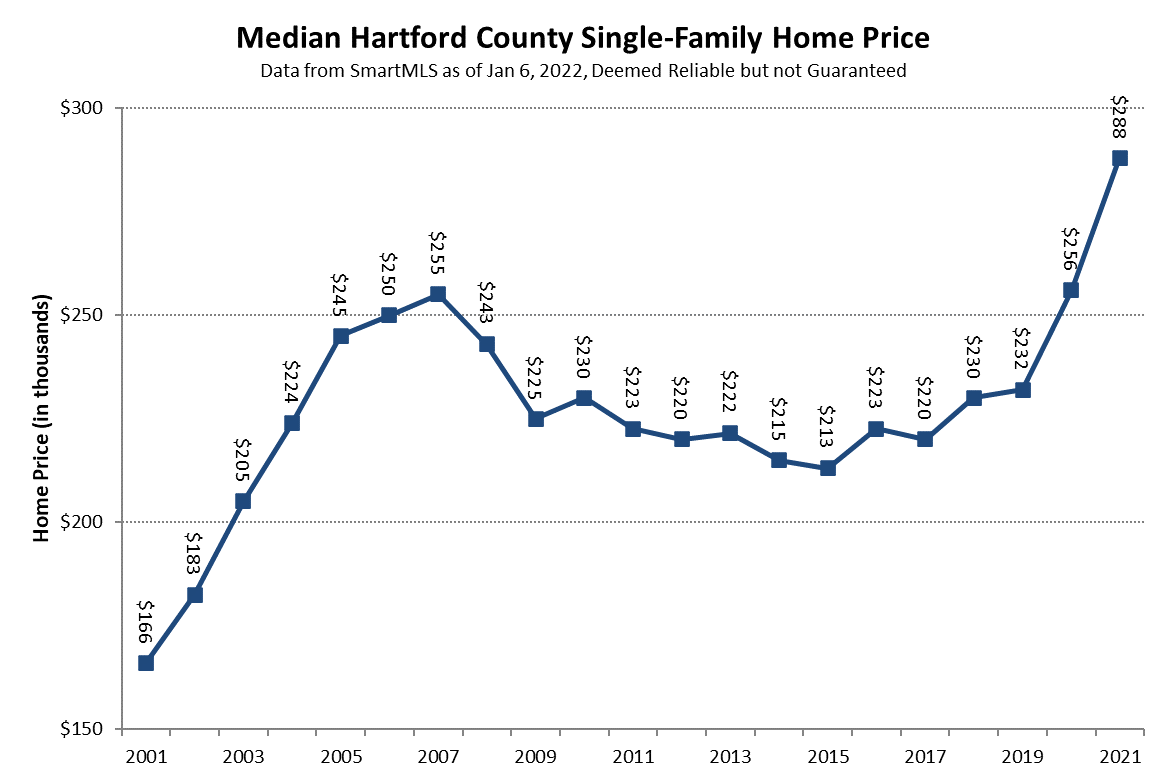
It is our annual tradition to look at the full year of data each January to see how the market evolved over the prior year. This is the one time when we analyze price data, as looking at 12 months gives a very large data set and minimizes the impact of seasonality. 2021 was a very active year for the Hartford County real estate market, despite finishing with slightly fewer closed single-family deals than in
Continue Reading
Hartford County finished 2017 with a slight increase in the number of single-family home sales compared to 2016. The total in the Connecticut MLS database as of 1/4/2018 was 8,649, or 1.6% higher than the previous year. Although there wasn’t significant growth in market activity, the deal total for the year remained close to the 2005 peak, signifying strong overall demand. Looking at the trend in pricing, the chart below shows that both the average
Continue Reading
The other day I posted the County level stats for sales activity and pricing. The big picture view gives a good sense of high level trends, but doesn’t provide much insight into the markets of individual towns. The reality of Greater Hartford real estate is that each town is its own market, and there can be very different dynamics at play. Here is a summary chart showing the activity and price changes in each of
Continue Reading
2016 was another good year for Hartford County real estate. It was the second year in a row that showed growth in the number of closed deals. The total number of single-family sales recorded in the Connecticut Multiple Listings Service (CTMLS) database was 8,515 (as of 1/6/2017). The number of closed sales increased by 10.6% over the 2015 total. As the above chart shows, the market has returned to the activity levels seen in the
Continue Reading
