Jobs are very important to the real estate market. The more information I have have about employment trends in Greater Hartford, the better I can advise clients as they look to buy and sell homes. I decided to attend a local job fair to see firsthand which companies are hiring, and how that compared to the number of job seekers. The quick summary is that Connecticut Convention Center’s top level ballroom was filled with both
The practice of buying and quickly reselling real estate is well established. It generally goes by the name of “flipping.” There are different business models under the broad umbrella of flipping, with different risk and return profiles. At one end of the spectrum Wholesalers try to buy super cheap by finding private deals. At the other end of the spectrum Renovators focus on adding value to a property through construction. Despite the easy profits shown
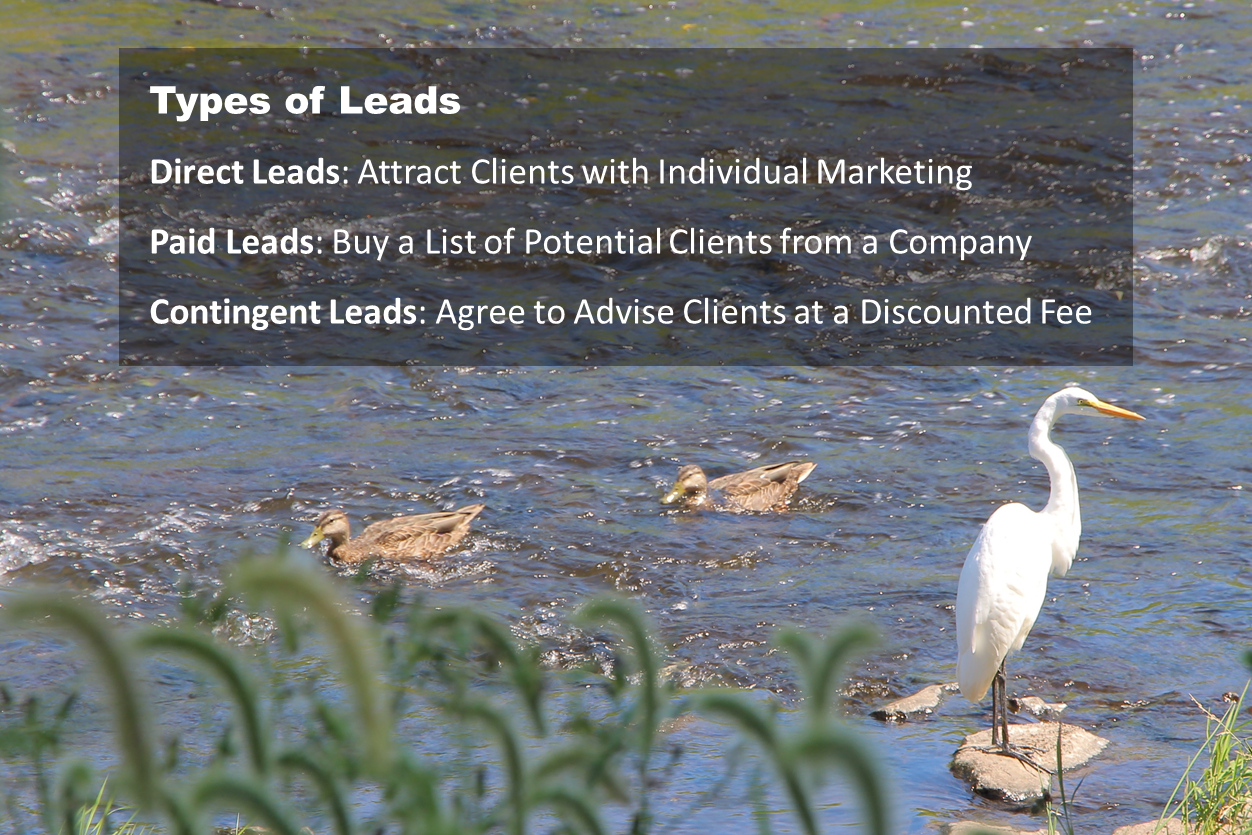
There is an active market for leads in real estate, though the economics are generally hidden from the public. I thought it would be a good idea to shine a light on this corner of the industry so that you can understand how it all works. Start with Part 1 if you are just joining us. Yes, you are a real estate lead. Everyone is a real estate lead! The key question is which type
There is an active market for leads in real estate, though the economics are generally hidden from the public. I thought it would be a good idea to shine a light on this corner of the industry so that you can understand how it all works. Start with Part 1 if you are just joining us. Contingent leads, like Paid leads, also involve the agent paying another party. However, for Contingent leads the agent doesn’t
There is an active market for leads in real estate, though the economics are generally hidden from the public. I thought it would be a good idea to shine a light on this corner of the industry so that you can understand how it all works. Start with Part 1 if you are just joining us. Paid leads are opportunities that an agent purchases from a 3rd party, usually an app/website. The general agreement is