Warning: What follows is quite dorktacular. You have been warned.
Last week we looked at the really big picture transactions data for Hartford County in 2011. The main concern we had with how the numbers turned out was that the average single-family home price appeared to rise slightly from 2010 to 2011, which was not what we saw in the market on a house by house basis.
There is no easy way to track the price trends in a region because every house is unique. Repeat sales is the best method I know of, but it’s too hard for us to use. Anyway, we were talking averages in the post. Our hypothesis as to why the average might be misleading in this case is that averages can be influenced by a change in the mix of homes that sold between the two years. They are especially susceptible to sales of expensive homes since one million dollar property contributes as much to the total sales volume as five $200,000 homes.
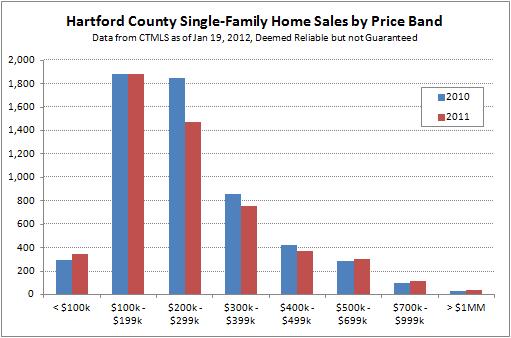
The first step we took to test our hypothesis was to look at how the mix of sales changed between the two years.

The chart shows that the number of sales increased in the sub-$100,000 price band and also in all three price bands above $500,000. It also shows that the $100,000s remained almost exactly the same. Finally, the number of deals in the $200,000s fell by about 20%, while both the $300,000s and $400,000s fell by about 12%. The chart confirms our anecdotal observation that there is was more interest in high end properties in 2011, but doesn’t address our hypothesis in a convincing manner.
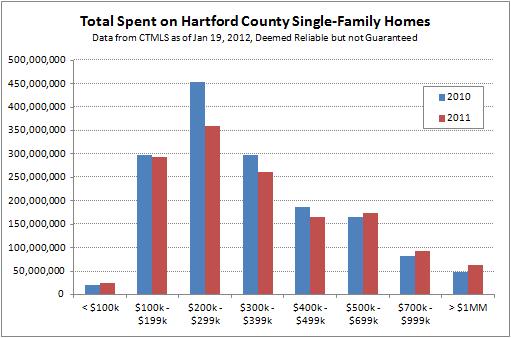
What if we plotted the total sales volume for each price band instead of the number of deals? That would put each of the price points on equal footing in terms of their contribution to the average.

This chart shows that the homes that sold for less than $100,000 matter very little in the average. But otherwise the chart is not conclusive about whether the average remained the same due to prices holding steady between the two years or some other reason.
Maybe we should just throw in the towel on the average as a proxy for home prices and move over to the median. Between 2010 and 2011 the median single-family home price in Hartford County fell 3.3% from $230,000 to $222,500.
Or we can just trust our observations of the market … home prices fell in 2011.