I recently received a few off-line comments about my recent post regarding real estate inventory levels in the Greater Hartford area.
Remember, real estate inventory for a specific town is calculated by taking the current number of homes on the market in that town and dividing it by the number of closings during the previous month in that town, or some derivation thereof.
In my calculation, I used February of 2008 to get the resulting inventory levels for right now. It was suggested by a few that I might want to look at the last 3 months and use the average number of closings. Others posed 6 months. For statistical relevance (“N” should be greater than 30), you know? Stinkin’ statistics…
Alright, I’m game. I’m curious to see how inventories for today would change based on the average number of closings for the longer time periods.
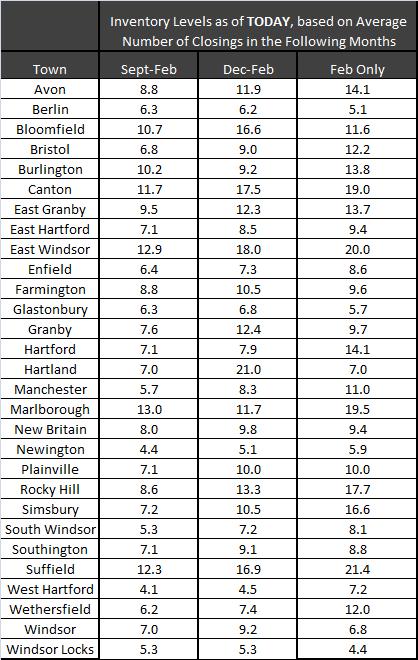
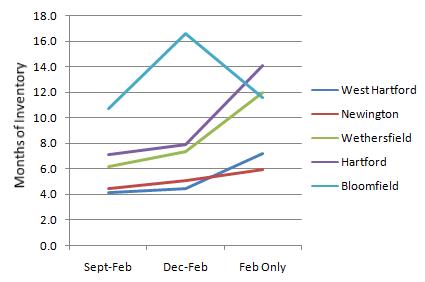
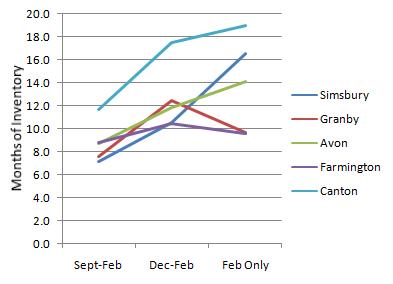
How to Read These Graphs: Each of the 3 points for each town represents real estate inventory as of today. The Sept-Feb point represents inventory as of today, using the average number of closings between September and February. The Dec-Feb point represents inventory as of today, using the average number of closings between December and February. The Feb Only point represents inventory as of today, using only the number of closings that occurred in February.
I tried to group the towns geographically, so here goes…
It appears that February was a really slow month for closings in these towns (except Bloomfield) because the inventory number significantly increases by going from the 3 months average of closings to only February’s closings. For these towns, it might be best to use the Dec-Feb number for a more balanced idea of inventory today because the trends were very gradual when using the 6 month and 3 months of average closing data (Sept-Feb and Dec-Feb).
The Farmington Valley appears to be a mixed bag. Canton inventory level is high, using fewer months of data only makes it worse. Avon and Simsbury follow the same path as Canton. All of these towns are in a buyers market, no matter how you look at it or how many months of average closing data you use.
For the most part, these towns have inventory levels that are fairly stable, no matter how many months of average closing data are used. Bristol had a very slow February.
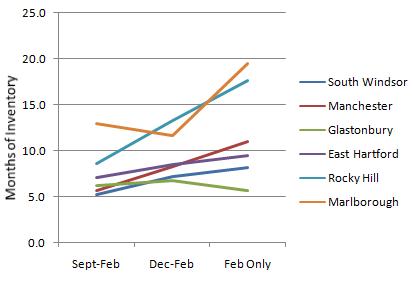
Rocky Hill’s inventory level dramatically changes when fewer months of average closing data are used. Glastonbury is very stable whether 6, 3, or 1 month of average closing data is used.
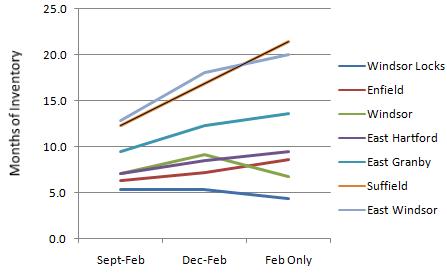
Most of these towns have the same inventory level, no matter how many months of average closed sales are used. Enfield and East Windsor appear to be effected when using fewer months of average closing data.
MY CONCLUSION: Other than that my head hurts, it appears for many of the towns that using the 3 months average of closing data (Dec-Feb) might be the most sensible for interpreting the current inventory level. It eliminates any spike for a short month of February and still covers the traditionally slower winter market.
Here’s the raw data behind the graphs if you’re curious. Look at the Dec-Feb column to get a better idea of the current inventory level in your town…