On Monday we highlighted the key data from the Year End 2009 Hartford County Property Report. The data definitely tells a story – sales in the fourth quarter are dramatically higher than last year – but there are other factors that are also important. The complete report, with statistics and charts for all the towns in the county, is available here.
Overall Environment
The housing market is influenced by the state of the local economy and the financial markets, neither of which has experienced smooth sailing over the past couple years. It is important to analyze the real estate markets in the context of the larger environment because it influenced what happened in the fourth quarter, and will shape the coming year.
Part of the reason that Q4 2009 experienced such strong year-over-year performance was that Q4 2008 was a complete disaster. The financial markets were in disarray for most of 2007 and 2008 as the subprime housing markets and larger credit markets began to unravel. When Lehman Brothers collapsed in September of 2008, the seriousness of the situation finally hit investors, who exited the stock market en masse. From that September through March 2009 stocks fell sharply, creating considerable uncertainty in just how bad this recession would be for the US economy.
The uncertainty was reflected in the actions of local home buyers. Sales from Q4 2007 through Q2 2009 were considerably below the recent trends, with Q1 2009 being one of the worst quarters. The strong stock market rally that began in March 2009 boosted the confidence of buyers, who were more active in the second half of the year.
Another important part of Q4 2009’s performance is the Federal Home Buyer Tax Credit. There was an unusually high number of closings in November, which coincided with the expected end of the First-Time Buyer’s Credit. For single-family homes, November was the third most active month for closings this year, only behind June and July.
The credit was extended and expanded, which will have important implications for the 2010 real estate market. Buyers qualifying for the credit need to sign purchase contracts by April 30th, so much of the activity in the traditionally busy spring market may pull forward. If buyers are active earlier than usual in hopes of capturing the credit, then it seems logical that sellers may list their homes for sale earlier in order to gain exposure to this larger pool. This is especially true for homes that will be attractive to first-time buyers. Because of the way the calendar falls, the first week in March is likely to be very busy once school vacation passes and sellers realize they need to list their home immediately in order for potential buyers to use the tax credit.
Local Trends and Observations
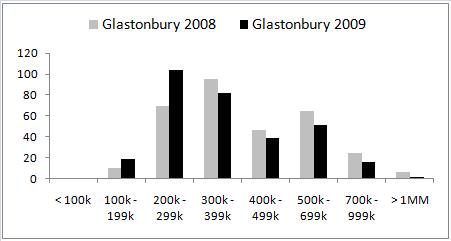
One of the most interesting real estate trends in 2009 was the variation in sales activity at different price points within a town. In general, lower price ranges were meaningfully more active than upper price ranges. The trend is visible for many towns in the charts at the back of the report.
 As a specific example, consider single-family sales in Glastonbury (chart shows number of single-family home transactions in different price bands). The number of 2009 sales for prices below $300,000 are considerably higher than the 2008 results. At the same time, the number of 2009 sales for prices above $300,000 are slightly less than 2008 in every price band.
Some of the data points are definitely homes falling in value and selling in the next lowest price band. However, the overall economy also played an important role, with the First-Time Buyer Tax Credit providing targeted support to the lower price points. In addition, buyers at the upper price points seemed to be less likely to stretch their budget, and many sellers took a “wait and see†approach before deciding whether to move up to a larger home.
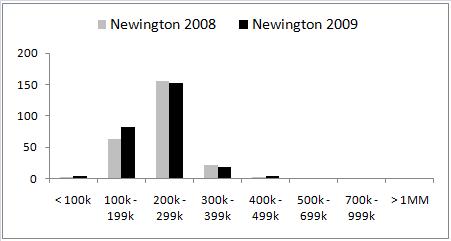
 Contrast Glastonbury to a town with much less housing stock diversity. Newington’s real estate market was 6.5% more active in 2009 than it was in 2008. Their chart shows that the vast majority of homes sold for less than $300,000, so they were not nearly as affected by the slowdown at the high end. In fact, the Newington market was so hot in 2009 that it was a seller’s market practically the whole year, leading to a New York Times article about the town.
One of the trend’s effects is to decrease the usefulness of the median home price as a gauge of home values. Changing the mix of sales by increasing the number of less expensive homes and decreasing the number of more expensive homes tends to decrease the median sales price in any market environment. Since prices have been generally falling in Hartford County, both the market and the sales mix are pushing the median price metric in the same direction — downward.
Revisiting the two example towns, Glastonbury homeowners should not take the 16% decrease in median sales price (table on page 4) too seriously. However, the change in median price of –4.4% is likely more meaningful in Newington since there is much less of an impact from a change in the mix of sales.