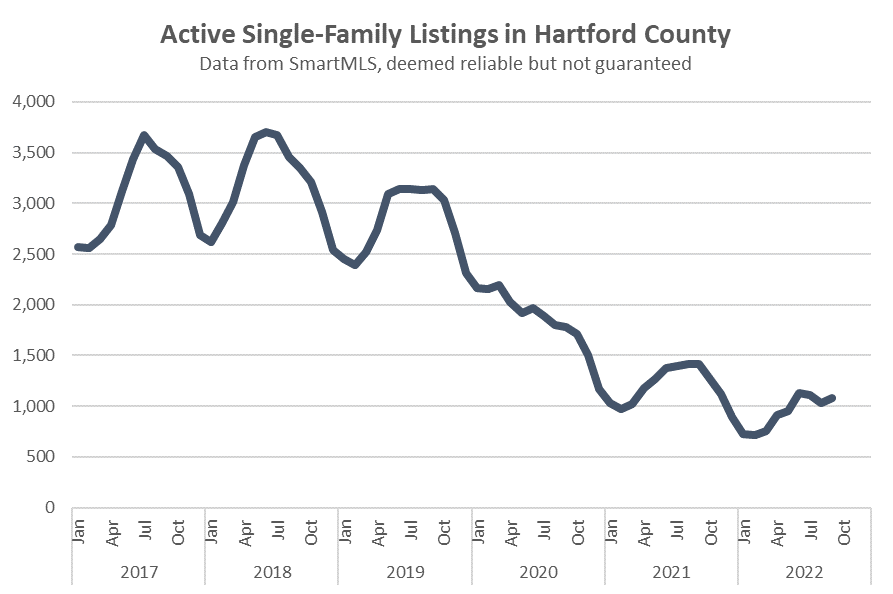
The number of active single-family home listings in Hartford County continues to be well below historical trends. The chart below shows the monthly total since 2017 as measured by SmartMLS. The seasonal fluctuations in active listings are clearly visible in each year except 2020. Inventory is highest in the summer and lowest at the very beginning of the year. What the chart shows is that the number of homes available to buyers is still trending
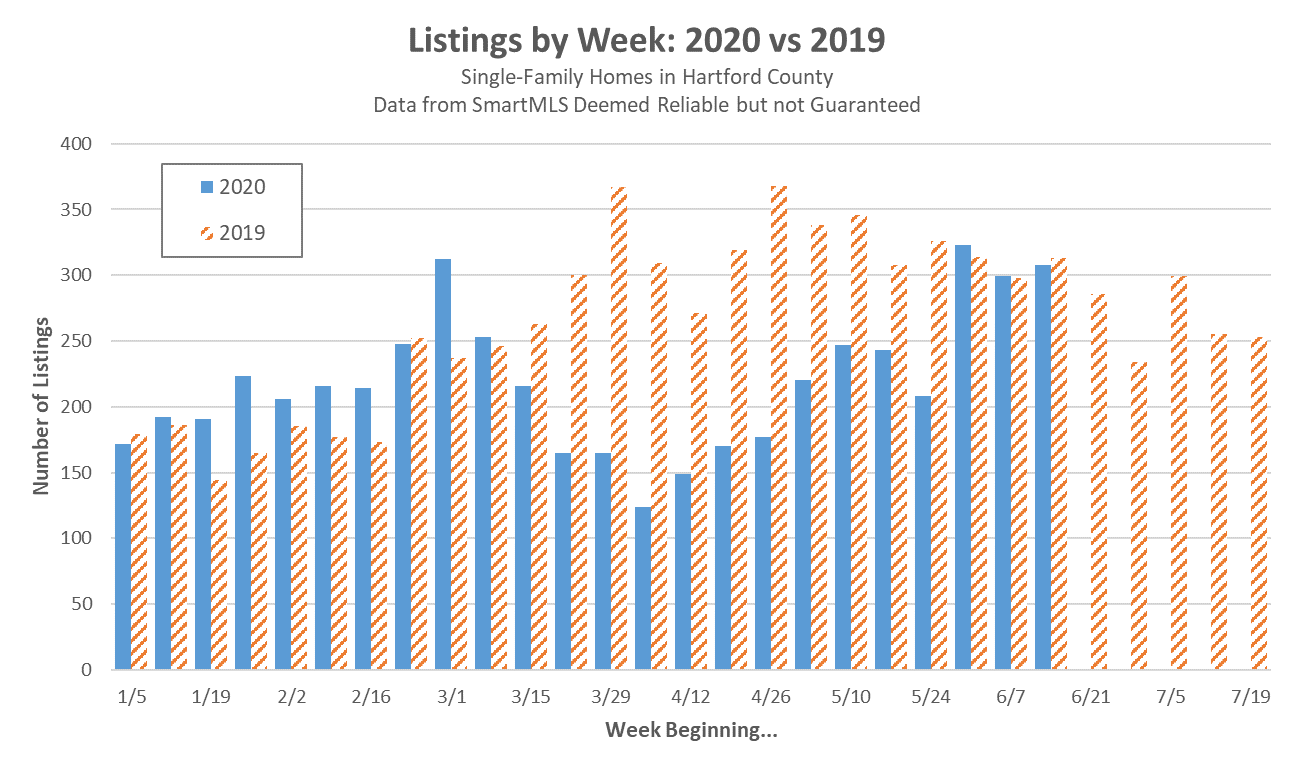
Summer is here. I can tell by the “Excessive Heat” warning in place due to today’s predicted 98 degree high temperature. That’s summer weather. But how does summer weather impact the real estate market? It’s time to update our chart of weekly listings to include the second half of the year. The number of Hartford County single-family listings each week is shown by the blue area in the background. As a point of comparison, the
Hartford County single-family owners have returned to a level of new listings that is in line with seasonal trends. Listing counts over the past three weeks have matched 2019 totals almost exactly. We have been watching the real estate market to see how it rebounds from the stay-at-home orders that interrupted the spring market. Our hope is that the spring market will shift into the summer months. There continues to be a very high level
I’ve been tracking the number of new listings on a weekly basis to understand how the coronavirus impacted the Greater Hartford real estate market. Data about new listings is easily gathered from the MLS, and is an immediate gauge of seller sentiment. Because the market was already showing low inventory before the virus arrived, new listings seemed like it would be the obvious bottleneck in the market. The manner in which the listing data was
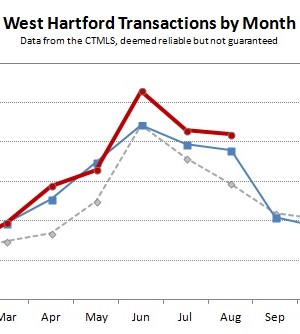
West Hartford finished August 2013 with 84 single-family closings, up from 76 in August of 2012. Overall the town is about 12% ahead of 2012 in terms of transactions. The most active price bands are showing an increase in activity over the past 12 months. Homes priced at the upper end of the market are in line with the previous year. However, at the lower end of the market there has been a 13% decrease