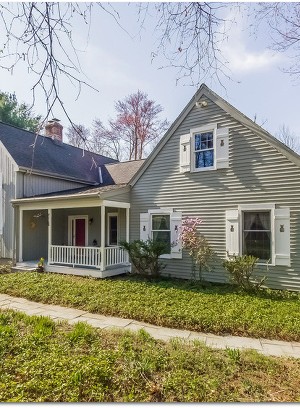
This post and beam Cape offers dramatic soaring ceilings and a flexible, open floor plan. Tucked away on 1.6 acres, the house is a private retreat, yet close to Canton’s amenities. The living room and dining room spaces, with double sided brick fireplace, connect to the updated kitchen with granite counters and stainless steel appliances. The kitchen and an adjacent sitting room walk out to the tiered deck, overlooking the secluded backyard. The master bedroom
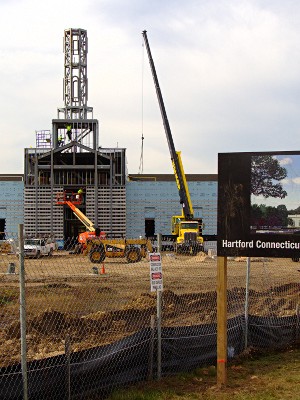
Construction of the Hartford Connecticut Temple of The Church of Jesus Christ of Latter-day Saints is making good progress. The actual site is on Farmington Avenue (Route 4) in Farmington, CT across from the entrance to Winding Trails and the Devonwood community. Plans for the temple were announced in 2010, and a groundbreaking ceremony was held in August of 2013. Those interested in learning more about the project, or the Church, can follow along online.
Here’s a quick look at how the Hartford County real estate markets performed last month. Closings in October reflect deals negotiated during the summer and fall depending on the amount of time between the contract date and the closing date. The data comes from the Connecticut Multiple Listing Service (CTMLS), which is deemed reliable but not guaranteed. Some Observations There was a wide range in the percent change in number of transactions for this October
Hartford County residential sales fell significantly in the third quarter of 2010 versus the third quarter of 2009 as buyers took a breather following the June expiration of the Federal Home Buyer Tax Credit. Median prices rose modestly over the year-previous quarter, while another measure of pricing, the median price per square foot, fell a comparable amount. Most noteworthy was the change in the mix of homes that sold as the Tax Credit phased out
Most people have a favorite house style. Ranches, capes, colonials, contemporaries, bungalows, split levels, tudors, farm houses, raised ranches, victorians- and a few others I’m surely forgetting. There is a house type for everyone and each of these styles have unique layouts and design features. When we work with buyers sometimes they are familiar with house styles and sometimes they are not. For example, we often find that buyers don’t realize that capes usually have